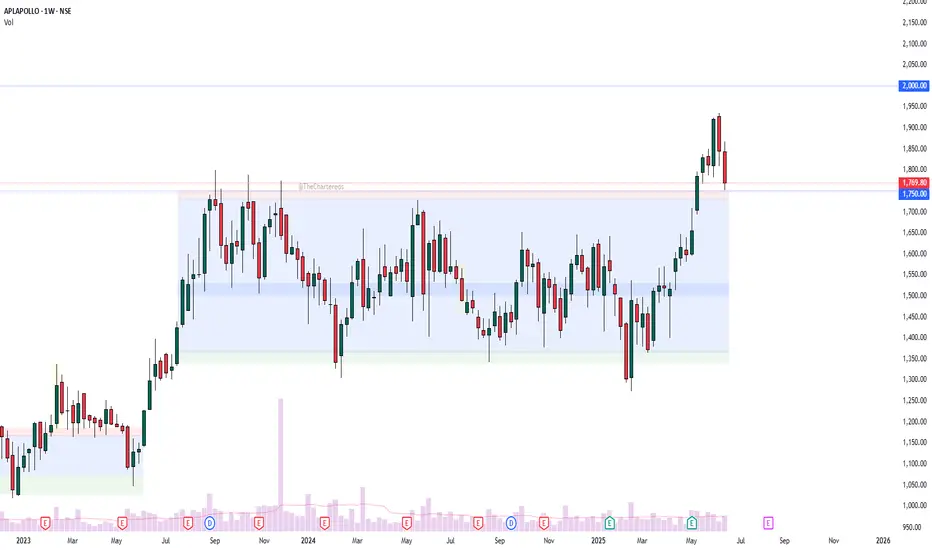
APL Apollo – Chart Analysis
The structure is quite clear:
Price consolidated within a tight range for nearly 2 years.
This was followed by a strong breakout accompanied by a notable volume spike.
Currently, the stock appears to be in the retest phase of the breakout zone.
Fundamental Trigger:
📢 APL Apollo Q4 Results: Net profit up 72% YoY; Board approves ₹1,500 Cr capex plan.
What’s next?
Will the retest hold and lead to the next leg up?
Let me know your thoughts 👇
Disclaimer: This analysis is for educational and informational purposes only. It is not investment advice or a recommendation to buy or sell any security. Please do your own research or consult a financial advisor before making any investment decisions. I am not a SEBI-registered advisor.
🎯 You can now access our personal charts for all Nifty 500 companies📈
👉 Visit nas.io/TradeWithTc to learn Price Action with real life case studies.
#BeYourOwnAnalyst
👉 Visit nas.io/TradeWithTc to learn Price Action with real life case studies.
#BeYourOwnAnalyst
Penerbitan berkaitan
Penafian
Maklumat dan penerbitan adalah tidak dimaksudkan untuk menjadi, dan tidak membentuk, nasihat untuk kewangan, pelaburan, perdagangan dan jenis-jenis lain atau cadangan yang dibekalkan atau disahkan oleh TradingView. Baca dengan lebih lanjut di Terma Penggunaan.