📊 BANKNIFTY TRADING PLAN — 02 DEC 2025
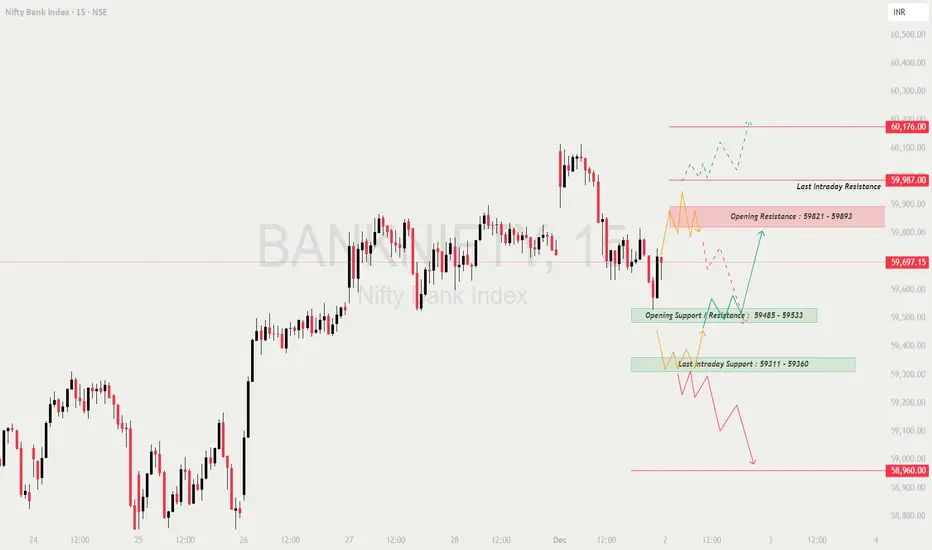
BankNifty closed around 59,697, sitting right between the Opening Resistance Zone (59,821–59,893) and the Opening Support / Resistance zone (59,485).
This creates a very sensitive region where the market may first trap traders before showing real direction.
The chart shows clear supply above and strong demand zones below, so the opening behavior will dictate whether the day becomes trend-continuation or a reversal session.
🔍 Key Intraday Zones
🟥 Opening Resistance Zone: 59,821 – 59,893
🟥 Last Intraday Resistance: 59,987
🟥 Major Resistance: 60,176
🟩 Opening Support / Resistance Zone: 59,485
🟩 Last Intraday Support Zone: 59,311 – 59,360
🟩 Major Breakdown Level: 58,960
🟢 SCENARIO 1 — GAP-UP OPENING (200+ Points)
If BankNifty opens around 59,900–60,050, price directly enters or opens above the resistance cluster.
📘 Educational Note:
Gap-ups into resistance are tricky.
Always wait for sustained acceptance above resistance rather than jumping in on the first candle.
🟧 SCENARIO 2 — FLAT OPENING (Near 59,650–59,720)
A flat open places the market between support and resistance → expect indecision.
💡 Educational Tip:
Flat openings are where the first 3–4 candles reveal the full day’s trend.
Let the market show its intention before taking the first trade.
🔻 SCENARIO 3 — GAP-DOWN OPENING (200+ Points)
A gap-down near 59,350–59,420 pulls price into the Last Intraday Support Zone (59,311–59,360).
📘 Educational Note:
Gap-downs into strong demand often give the best reversal trades of the day —
but only after a higher low forms. Avoid revenge trades.
💼 RISK MANAGEMENT TIPS FOR OPTION TRADERS 💡
⚠️ Golden Rule:
Capital protection is the real edge.
Consistency beats jackpot trades.
📌 SUMMARY
Bullish Above:
59,821 → 59,893 → 59,987 → 60,176
Bearish Below:
59,485 → 59,360 → 59,311 → 58,960
Strong Reversal Zones:
🟩 59,311–59,360
🟩 58,960 (Major Demand Zone)
🟥 59,893–59,987 (Heavy Supply Zone)
No-Trade Zones:
⚠️ Inside 59,650–59,750
⚠️ Direct middle-of-structure price at open
🧾 CONCLUSION
The market will primarily react to the 59,821 resistance and the 59,485 support.
These two levels will decide whether the trend continues upward or transitions to a corrective phase.
✔️ Breakout above 59,821 = Long opportunity
✔️ Breakdown below 59,485 = Short continuation
✔️ Reversal trades possible only at 59,311 or 58,960
Trade only after confirmation — avoid impulsive entries.
⚠️ DISCLAIMER
I am not a SEBI-registered analyst.
This analysis is for educational purposes only.
Consult your financial advisor before making any trading decisions.
BankNifty closed around 59,697, sitting right between the Opening Resistance Zone (59,821–59,893) and the Opening Support / Resistance zone (59,485).
This creates a very sensitive region where the market may first trap traders before showing real direction.
The chart shows clear supply above and strong demand zones below, so the opening behavior will dictate whether the day becomes trend-continuation or a reversal session.
🔍 Key Intraday Zones
🟥 Opening Resistance Zone: 59,821 – 59,893
🟥 Last Intraday Resistance: 59,987
🟥 Major Resistance: 60,176
🟩 Opening Support / Resistance Zone: 59,485
🟩 Last Intraday Support Zone: 59,311 – 59,360
🟩 Major Breakdown Level: 58,960
🟢 SCENARIO 1 — GAP-UP OPENING (200+ Points)
If BankNifty opens around 59,900–60,050, price directly enters or opens above the resistance cluster.
- []If price sustains above 59,893 for 10–15 minutes with strong volume →
⭐ Upside targets → 59,987 → 60,100 → 60,176
This is a classical continuation breakout structure.
[]If price rejects 59,893–59,987, expect a pullback toward:
➡️ 59,700 → 59,485
[]Best Long Setup →
Breakout above 59,987 + Retest + Bullish candle.
[]Avoid aggressive shorts immediately at open during a gap-up —
early supply tests often cause fake breakdowns.
📘 Educational Note:
Gap-ups into resistance are tricky.
Always wait for sustained acceptance above resistance rather than jumping in on the first candle.
🟧 SCENARIO 2 — FLAT OPENING (Near 59,650–59,720)
A flat open places the market between support and resistance → expect indecision.
- []If price breaks above 59,821, upside targets →
59,893 → 59,987
[]If price breaks below 59,485, downside opens up toward:
➡️ 59,360 → 59,311
[]Avoid trading inside 59,650–59,750 until structure becomes clear.
This is a noise zone.
[]Two high-probability setups:
✔️ Breakout–retest above 59,821
✔️ Breakdown–retest below 59,485
💡 Educational Tip:
Flat openings are where the first 3–4 candles reveal the full day’s trend.
Let the market show its intention before taking the first trade.
🔻 SCENARIO 3 — GAP-DOWN OPENING (200+ Points)
A gap-down near 59,350–59,420 pulls price into the Last Intraday Support Zone (59,311–59,360).
- []If price holds 59,311–59,360 with long lower wicks →
Upside bounce targets →
59,485 → 59,650 → 59,821
[]If support breaks →
Next downside → 59,150 → 59,020 → 58,960
[]A sharp bounce from 58,960 is possible —
this is a major liquidity zone where buyers historically step in.
[]Aggressive selling only below 58,960 with confirmation.
Targets → 58,820 → 58,700
📘 Educational Note:
Gap-downs into strong demand often give the best reversal trades of the day —
but only after a higher low forms. Avoid revenge trades.
💼 RISK MANAGEMENT TIPS FOR OPTION TRADERS 💡
- []Avoid trading the first 5 minutes after market opens.
[]For directional moves, choose ATM or ITM options.
[]Stop-loss must always be tied to chart structure — not premium price.
[]Do NOT average losing positions. Cut fast.
[]Trail your SL once first target hits — protect your gains.
[]Low VIX → Option buying becomes favorable.
High VIX → Prefer hedged spreads for safety.
⚠️ Golden Rule:
Capital protection is the real edge.
Consistency beats jackpot trades.
📌 SUMMARY
Bullish Above:
59,821 → 59,893 → 59,987 → 60,176
Bearish Below:
59,485 → 59,360 → 59,311 → 58,960
Strong Reversal Zones:
🟩 59,311–59,360
🟩 58,960 (Major Demand Zone)
🟥 59,893–59,987 (Heavy Supply Zone)
No-Trade Zones:
⚠️ Inside 59,650–59,750
⚠️ Direct middle-of-structure price at open
🧾 CONCLUSION
The market will primarily react to the 59,821 resistance and the 59,485 support.
These two levels will decide whether the trend continues upward or transitions to a corrective phase.
✔️ Breakout above 59,821 = Long opportunity
✔️ Breakdown below 59,485 = Short continuation
✔️ Reversal trades possible only at 59,311 or 58,960
Trade only after confirmation — avoid impulsive entries.
⚠️ DISCLAIMER
I am not a SEBI-registered analyst.
This analysis is for educational purposes only.
Consult your financial advisor before making any trading decisions.
Penafian
Maklumat dan penerbitan adalah tidak bertujuan, dan tidak membentuk, nasihat atau cadangan kewangan, pelaburan, dagangan atau jenis lain yang diberikan atau disahkan oleh TradingView. Baca lebih dalam Terma Penggunaan.
Penafian
Maklumat dan penerbitan adalah tidak bertujuan, dan tidak membentuk, nasihat atau cadangan kewangan, pelaburan, dagangan atau jenis lain yang diberikan atau disahkan oleh TradingView. Baca lebih dalam Terma Penggunaan.