4-Hour Chart (Macro Trend)
Structure: The Bank Nifty is in an Aggressive Bullish Momentum phase. The index hit a new All-Time High (ATH) of 58,577.50 before the close, creating a large upper wick and confirming strong selling/profit-booking at the peak. The price has breached the lower trendline of the steep ascending channel and closed below the 9-period EMA.
Key Levels:
Major Supply (Resistance): 58,577 - 58,700 (All-Time High Zone). This area will be fiercely defended by sellers.
Major Demand (Support): 57,800 - 58,000. This area, which includes the lower channel trendline and a recent Fair Value Gap (FVG), is the must-hold zone to prevent a larger correction.
Outlook: The bias is Cautiously Bullish. The structure is highly positive, but the sharp intraday selling suggests a pause or a deeper retest of support is likely before the next breakout.
1-Hour Chart (Intermediate View)
Structure: The 1H chart shows a clear Break of Structure (MSS) to the downside in the immediate term, marked by the break of the swing low (implied by the dashed line) and the sharp drop from the ATH. The price is now trading right on the support of the 57,800 - 58,000 zone.
Key Levels:
Immediate Resistance: 58,400 (Recent swing high).
Immediate Support: 57,800 (The FVG and strong horizontal support).
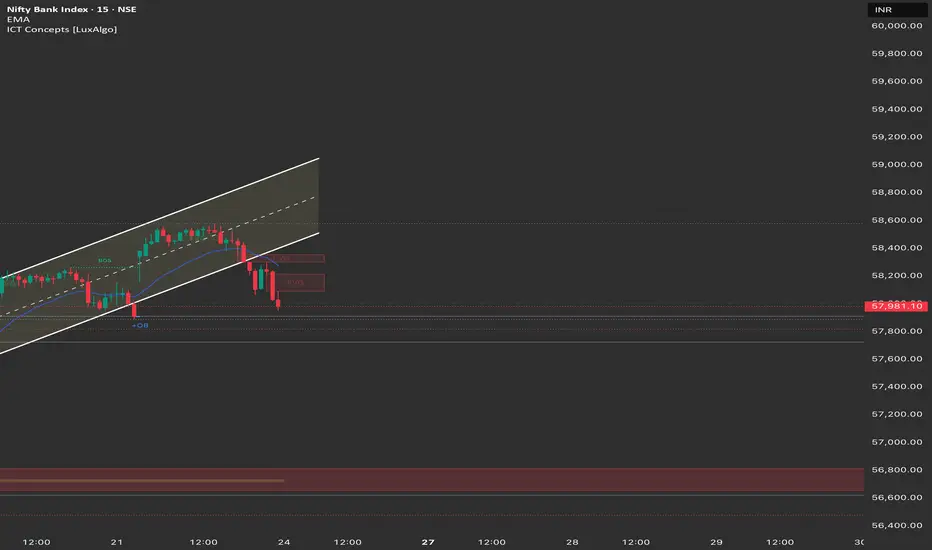
15-Minute Chart (Intraday View)
Structure: The 15M chart shows a clean descending channel formation from the ATH, confirming intraday bearish control. The market closed right at the lower end of the channel, indicating bears are currently in charge.
Key Levels:
Intraday Supply: 58,200 (Upper trendline of the descending channel).
Intraday Demand: 57,800.
Outlook: Neutral-to-Bearish for the session open, favoring trading the range.
📈 Structure Analysis & Trade Plan: 24th October
Market Outlook: Bank Nifty is consolidating after hitting a new ATH. The strong selling pressure requires a cautious approach. The strategy is to trade the tight range around 57,800 to 58,400.
Bullish Scenario (Buy the Dip/Breakout)
Justification: The multi-day rally and strong momentum of the banking sector remain intact (outperforming Nifty).
Entry: Long entry on a decisive break and 15-minute candle close above 58,200 (breaking the descending channel/FVG) OR Long on a bounce and reversal from the 57,600 - 57,800 zone (Major support/Buyer's OB).
Stop Loss (SL): Place a stop loss below 57,500 (below the recent consolidation low).
Targets:
T1: 58,577 (New ATH retest).
T2: 59,000 (Psychological extension target).
Bearish Scenario (Primary Plan: Sell on Breakdown)
Justification: The sharp rejection from the ATH suggests the peak may hold, leading to a deeper correction.
Trigger: A decisive break and 1-hour close below 57,800.
Entry: Short entry below 57,800.
Stop Loss (SL): Above 58,100.
Targets:
T1: 57,400 (Previous breakout high/FVG).
T2: 57,000 (Psychological support/Major FVG).
Key Levels for Observation:
Immediate Decision Point: 57,800 - 58,200 zone.
Bullish Confirmation: Sustained trade above 58,200.
Bearish Warning: A move below 57,800.
Line in the Sand: 57,500. A break below this level shifts the short-term bias to corrective.
Structure: The Bank Nifty is in an Aggressive Bullish Momentum phase. The index hit a new All-Time High (ATH) of 58,577.50 before the close, creating a large upper wick and confirming strong selling/profit-booking at the peak. The price has breached the lower trendline of the steep ascending channel and closed below the 9-period EMA.
Key Levels:
Major Supply (Resistance): 58,577 - 58,700 (All-Time High Zone). This area will be fiercely defended by sellers.
Major Demand (Support): 57,800 - 58,000. This area, which includes the lower channel trendline and a recent Fair Value Gap (FVG), is the must-hold zone to prevent a larger correction.
Outlook: The bias is Cautiously Bullish. The structure is highly positive, but the sharp intraday selling suggests a pause or a deeper retest of support is likely before the next breakout.
1-Hour Chart (Intermediate View)
Structure: The 1H chart shows a clear Break of Structure (MSS) to the downside in the immediate term, marked by the break of the swing low (implied by the dashed line) and the sharp drop from the ATH. The price is now trading right on the support of the 57,800 - 58,000 zone.
Key Levels:
Immediate Resistance: 58,400 (Recent swing high).
Immediate Support: 57,800 (The FVG and strong horizontal support).
15-Minute Chart (Intraday View)
Structure: The 15M chart shows a clean descending channel formation from the ATH, confirming intraday bearish control. The market closed right at the lower end of the channel, indicating bears are currently in charge.
Key Levels:
Intraday Supply: 58,200 (Upper trendline of the descending channel).
Intraday Demand: 57,800.
Outlook: Neutral-to-Bearish for the session open, favoring trading the range.
📈 Structure Analysis & Trade Plan: 24th October
Market Outlook: Bank Nifty is consolidating after hitting a new ATH. The strong selling pressure requires a cautious approach. The strategy is to trade the tight range around 57,800 to 58,400.
Bullish Scenario (Buy the Dip/Breakout)
Justification: The multi-day rally and strong momentum of the banking sector remain intact (outperforming Nifty).
Entry: Long entry on a decisive break and 15-minute candle close above 58,200 (breaking the descending channel/FVG) OR Long on a bounce and reversal from the 57,600 - 57,800 zone (Major support/Buyer's OB).
Stop Loss (SL): Place a stop loss below 57,500 (below the recent consolidation low).
Targets:
T1: 58,577 (New ATH retest).
T2: 59,000 (Psychological extension target).
Bearish Scenario (Primary Plan: Sell on Breakdown)
Justification: The sharp rejection from the ATH suggests the peak may hold, leading to a deeper correction.
Trigger: A decisive break and 1-hour close below 57,800.
Entry: Short entry below 57,800.
Stop Loss (SL): Above 58,100.
Targets:
T1: 57,400 (Previous breakout high/FVG).
T2: 57,000 (Psychological support/Major FVG).
Key Levels for Observation:
Immediate Decision Point: 57,800 - 58,200 zone.
Bullish Confirmation: Sustained trade above 58,200.
Bearish Warning: A move below 57,800.
Line in the Sand: 57,500. A break below this level shifts the short-term bias to corrective.
Penafian
Maklumat dan penerbitan adalah tidak dimaksudkan untuk menjadi, dan tidak membentuk, nasihat untuk kewangan, pelaburan, perdagangan dan jenis-jenis lain atau cadangan yang dibekalkan atau disahkan oleh TradingView. Baca dengan lebih lanjut di Terma Penggunaan.
Penafian
Maklumat dan penerbitan adalah tidak dimaksudkan untuk menjadi, dan tidak membentuk, nasihat untuk kewangan, pelaburan, perdagangan dan jenis-jenis lain atau cadangan yang dibekalkan atau disahkan oleh TradingView. Baca dengan lebih lanjut di Terma Penggunaan.