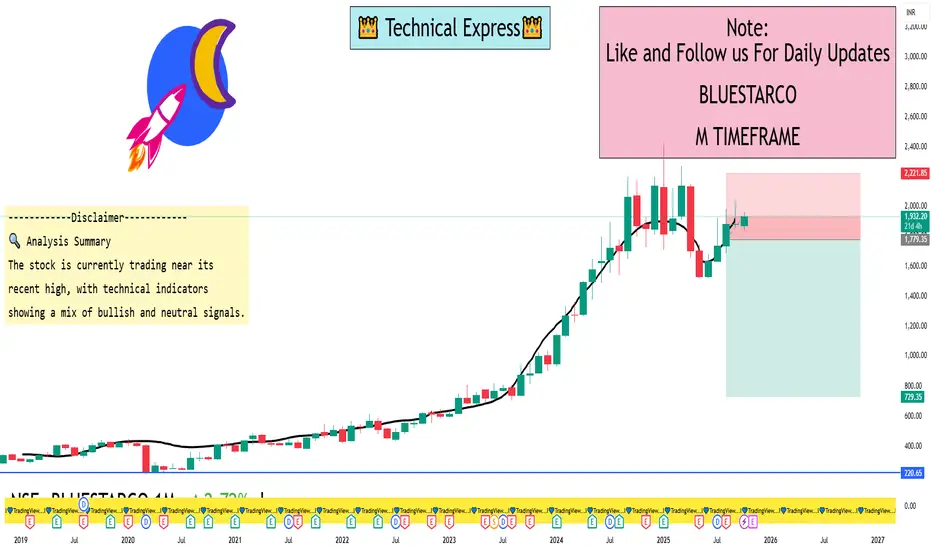
📈 Current Price and Trend
Current Price: ₹1,931.10
1-Month Price Change: Approximately +2.62%
52-Week Range: ₹1,521.20 – ₹2,419.95
Recent High: ₹1,964.70 on October 10, 2025
📊 Key Technical Indicators
RSI (14): 47.98 — Neutral, indicating neither overbought nor oversold conditions.
Stochastic RSI (14): 0.13 — Suggests a strong downtrend.
CCI (14): -69.38 — Indicates a downtrend.
MACD (12,26): 8.68 — Bullish crossover, suggesting upward momentum.
ADX (14): 30.75 — Indicates a strong trend.
Williams %R: -38.13 — Bullish, but not yet in the overbought zone.
ATR (14): 19.24 — High volatility.
ROC (12): 1.89 — Positive, indicating upward momentum.
Bull/Bear Power (13): 55.87 — Indicates bullish strength.
🔍 Analysis Summary
The stock is currently trading near its recent high, with technical indicators showing a mix of bullish and neutral signals. The RSI and Stochastic RSI suggest a neutral to slightly bearish short-term outlook, while the MACD, ADX, and Williams %R indicate potential for continued upward momentum. The high ATR value points to increased volatility, which traders should consider when making decisions.
I built a Buy & Sell Signal Indicator with 85% accuracy.
📈 Get access via DM or
WhatsApp: wa.link/d997q0
Contact - +91 76782 40962
| Email: techncialexpress@gmail.com
| Script Coder | Trader | Investor | From India
📈 Get access via DM or
WhatsApp: wa.link/d997q0
Contact - +91 76782 40962
| Email: techncialexpress@gmail.com
| Script Coder | Trader | Investor | From India
Penerbitan berkaitan
Penafian
The information and publications are not meant to be, and do not constitute, financial, investment, trading, or other types of advice or recommendations supplied or endorsed by TradingView. Read more in the Terms of Use.