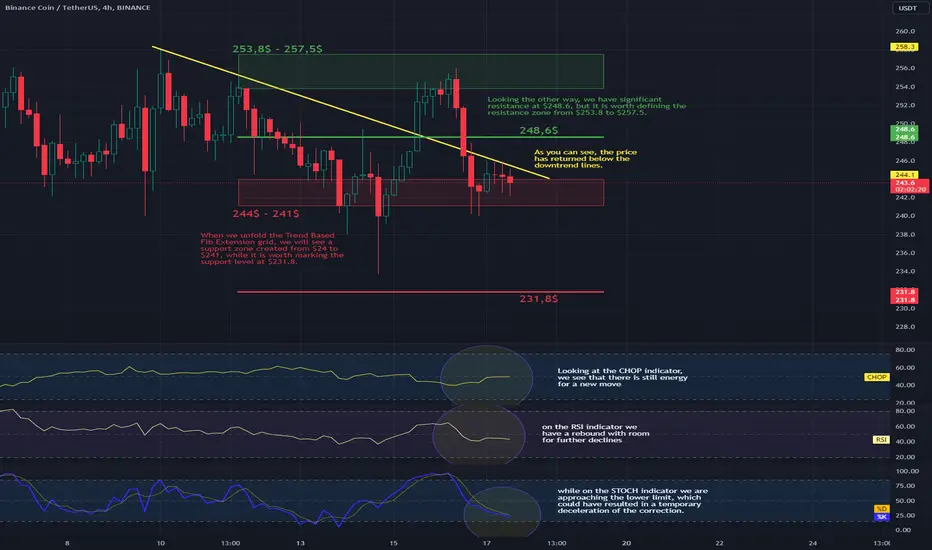
Hello everyone, let's take a look at the BNB to USDT chart on a 4-hour time frame. As you can see, the price has returned below the downtrend lines.
When we unfold the Trend Based Fib Extension grid, we will see a support zone created from $24 to $241, while it is worth marking the support level at $231.8.
Looking the other way, we have significant resistance at $248.6, but it is worth defining the resistance zone from $253.8 to $257.5.
Looking at the CHOP indicator, we see that there is still energy for a new move, on the RSI indicator we have a rebound with room for further declines, while on the STOCH indicator we are approaching the lower limit, which could have resulted in a temporary deceleration of the correction.
Penafian
Maklumat dan penerbitan adalah tidak bertujuan, dan tidak membentuk, nasihat atau cadangan kewangan, pelaburan, dagangan atau jenis lain yang diberikan atau disahkan oleh TradingView. Baca lebih dalam Terma Penggunaan.
Penafian
Maklumat dan penerbitan adalah tidak bertujuan, dan tidak membentuk, nasihat atau cadangan kewangan, pelaburan, dagangan atau jenis lain yang diberikan atau disahkan oleh TradingView. Baca lebih dalam Terma Penggunaan.