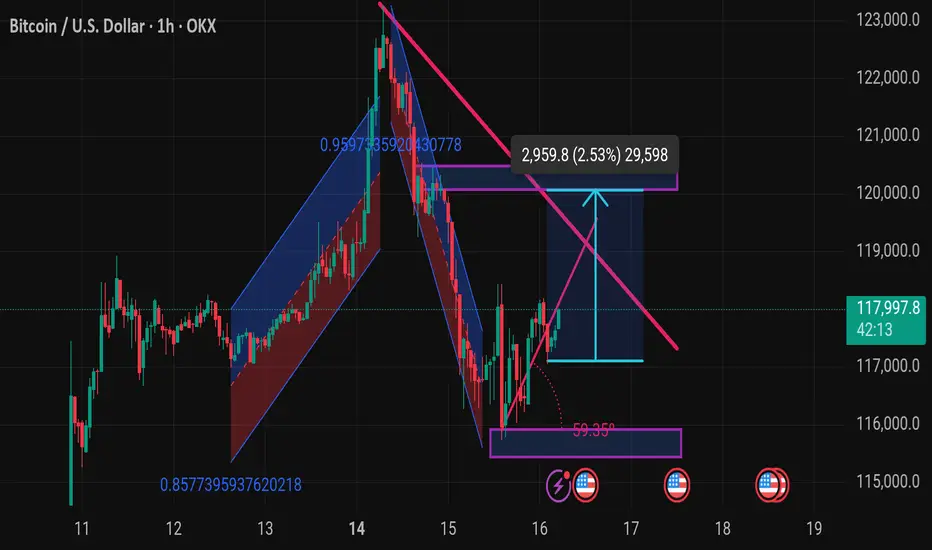
This Bitcoin (BTC/USD) chart from TradingView illustrates a technical analysis on the 1-hour timeframe. Here's a breakdown of the key elements and possible implications:
---
🔍 Chart Overview:
Current Price: $117,997.8
Timeframe: 1-hour candles
Exchange: OKX
Date/Time: July 16, 2025, 05:16 UTC
---
🧠 Key Technical Patterns & Indicators:
1. Descending Triangle Breakout Setup:
A descending resistance line (in pink) is converging with a horizontal support level (around $116,000–$117,000).
The price appears to be testing the upper boundary, indicating a potential breakout.
2. Target Measurement:
The blue arrow pointing upward suggests a measured move after a breakout.
Target Price: ~ $120,957.8 (approx. 2.53% move or +2,959.8 points from breakout level)
3. Support Zone:
Strong horizontal support zone marked in purple near $116,000.
This zone has held despite a sharp dip, indicating buyer interest.
4. Previous Trend Channels:
Blue and red channels represent bullish and bearish trends.
Recent bearish
---
🔍 Chart Overview:
Current Price: $117,997.8
Timeframe: 1-hour candles
Exchange: OKX
Date/Time: July 16, 2025, 05:16 UTC
---
🧠 Key Technical Patterns & Indicators:
1. Descending Triangle Breakout Setup:
A descending resistance line (in pink) is converging with a horizontal support level (around $116,000–$117,000).
The price appears to be testing the upper boundary, indicating a potential breakout.
2. Target Measurement:
The blue arrow pointing upward suggests a measured move after a breakout.
Target Price: ~ $120,957.8 (approx. 2.53% move or +2,959.8 points from breakout level)
3. Support Zone:
Strong horizontal support zone marked in purple near $116,000.
This zone has held despite a sharp dip, indicating buyer interest.
4. Previous Trend Channels:
Blue and red channels represent bullish and bearish trends.
Recent bearish
🎯XAUUSD GOLD Daily 8-9 Free Signals🚀 World Best community Join Here ✅
💫XAUUSD
💫BTC
💫EURUSD
For Signals Telegram channel
⬇️⬇️⬇️⬇️⬇️⬇️⬇️⬇️⬇️⬇️⬇️⬇️⬇️
t.me/technicaltrader10
💫XAUUSD
💫BTC
💫EURUSD
For Signals Telegram channel
⬇️⬇️⬇️⬇️⬇️⬇️⬇️⬇️⬇️⬇️⬇️⬇️⬇️
t.me/technicaltrader10
Penafian
Maklumat dan penerbitan adalah tidak dimaksudkan untuk menjadi, dan tidak membentuk, nasihat untuk kewangan, pelaburan, perdagangan dan jenis-jenis lain atau cadangan yang dibekalkan atau disahkan oleh TradingView. Baca dengan lebih lanjut di Terma Penggunaan.