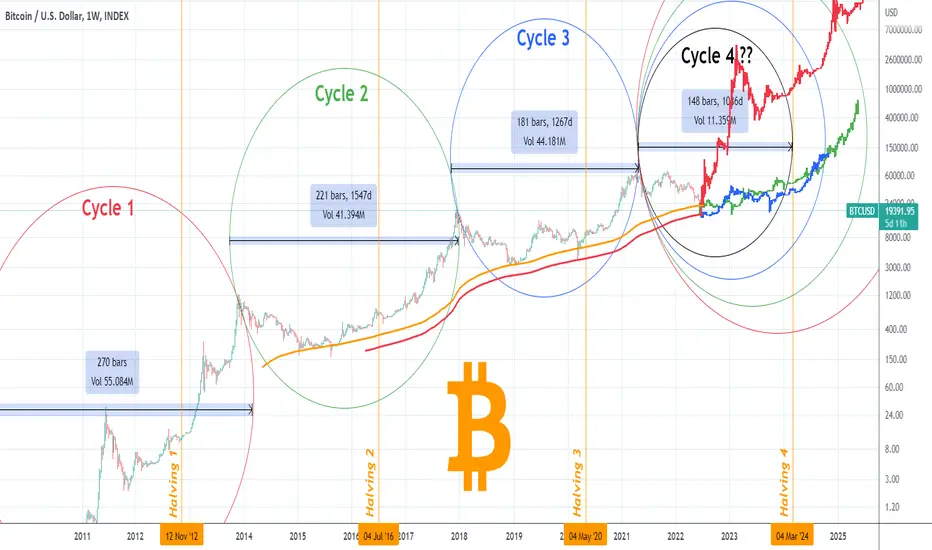
Bitcoin (BTCUSD) has started the 3rd straight week of consolidation above the 1W MA300 (red trend-line) after nearly hitting the level on the weekly candle of June 13. I've made extensive publications on the importance of this level as a Support and this time I want to elaborate on the Hyper-Cycle Theory (HCT) that reveals a progression on the extension of each Cycle and projects where we are now relative to each Cycle and how far we might go.
As you see each Cycle (Cycle 1 with the red, Cycle 2 with the green, Cycle 3 with the blue and Cycle 4 with the black trend-line) up to the April 2021 top is approximately 0.819 of the previous one. Based on that, Cycle 4 should be roughly extend for 148 weeks (1086 days) from the April High (181 weeks Cycle 3 / 221 weeks Cycle 2). That however puts the next Cycle Top exactly on the next Halving which is on March 2024. This comes in contrast to all prior Cycles that had their most aggressive Bull runs (parabolic rallies) right after the supply shock of each Halving. Of course if this theory of lower volatility for Bitcoin as adoption becomes greater in time, should at some point create fewer and fewer market extremes with smaller Cycles of Highs and Lows and break this Halving model.
For projection reasons, I've plotted each of the past three Cycles starting at the April 2021 High. Surprisingly, each candle projection roughly fills the remainder of their respective Cycle. This may indicate that in a symmetric way on this Cycle, we are at the point where all prior Cycles formed their bottoms proportionately. If that's the case, then BTC is still before the middle of the Cycle, even if the 0.819 progression model stands, giving plenty of time for the next Bull Run, even if it peaks before the Halving. Proportionately though, a repeat of Cycle 3 or better yet Cycle 2 would appear to be more fitting to the Halving model. But lets stick to the HCT model for now. Obviously a repeat of Cycle 1, that high that quickly especially, would be too unrealistic in market cap terms.
So which projection is more fitting according to you? Do you agree with the model predicting a Cycle Top before the next Halving? Feel free to share your work and let me know in the comments section below!
Important Note: Axis movements clearly distort the Cycles on the chart. If they get out of context on your monitor, try moving them to their original position based on the snapshot of the original snapshot of the chart:

--------------------------------------------------------------------------------------------------------
Please like, subscribe and share your ideas and charts with the community!
--------------------------------------------------------------------------------------------------------
As you see each Cycle (Cycle 1 with the red, Cycle 2 with the green, Cycle 3 with the blue and Cycle 4 with the black trend-line) up to the April 2021 top is approximately 0.819 of the previous one. Based on that, Cycle 4 should be roughly extend for 148 weeks (1086 days) from the April High (181 weeks Cycle 3 / 221 weeks Cycle 2). That however puts the next Cycle Top exactly on the next Halving which is on March 2024. This comes in contrast to all prior Cycles that had their most aggressive Bull runs (parabolic rallies) right after the supply shock of each Halving. Of course if this theory of lower volatility for Bitcoin as adoption becomes greater in time, should at some point create fewer and fewer market extremes with smaller Cycles of Highs and Lows and break this Halving model.
For projection reasons, I've plotted each of the past three Cycles starting at the April 2021 High. Surprisingly, each candle projection roughly fills the remainder of their respective Cycle. This may indicate that in a symmetric way on this Cycle, we are at the point where all prior Cycles formed their bottoms proportionately. If that's the case, then BTC is still before the middle of the Cycle, even if the 0.819 progression model stands, giving plenty of time for the next Bull Run, even if it peaks before the Halving. Proportionately though, a repeat of Cycle 3 or better yet Cycle 2 would appear to be more fitting to the Halving model. But lets stick to the HCT model for now. Obviously a repeat of Cycle 1, that high that quickly especially, would be too unrealistic in market cap terms.
So which projection is more fitting according to you? Do you agree with the model predicting a Cycle Top before the next Halving? Feel free to share your work and let me know in the comments section below!
Important Note: Axis movements clearly distort the Cycles on the chart. If they get out of context on your monitor, try moving them to their original position based on the snapshot of the original snapshot of the chart:
--------------------------------------------------------------------------------------------------------
Please like, subscribe and share your ideas and charts with the community!
--------------------------------------------------------------------------------------------------------
👑Best Signals (Forex/Crypto+70% accuracy) & Account Management (+20% profit/month on 10k accounts)
💰Free Channel t.me/tradingshotglobal
🤵Contact info@tradingshot.com t.me/tradingshot
🔥New service: next X100 crypto GEMS!
💰Free Channel t.me/tradingshotglobal
🤵Contact info@tradingshot.com t.me/tradingshot
🔥New service: next X100 crypto GEMS!
Penafian
Maklumat dan penerbitan adalah tidak dimaksudkan untuk menjadi, dan tidak membentuk, nasihat untuk kewangan, pelaburan, perdagangan dan jenis-jenis lain atau cadangan yang dibekalkan atau disahkan oleh TradingView. Baca dengan lebih lanjut di Terma Penggunaan.