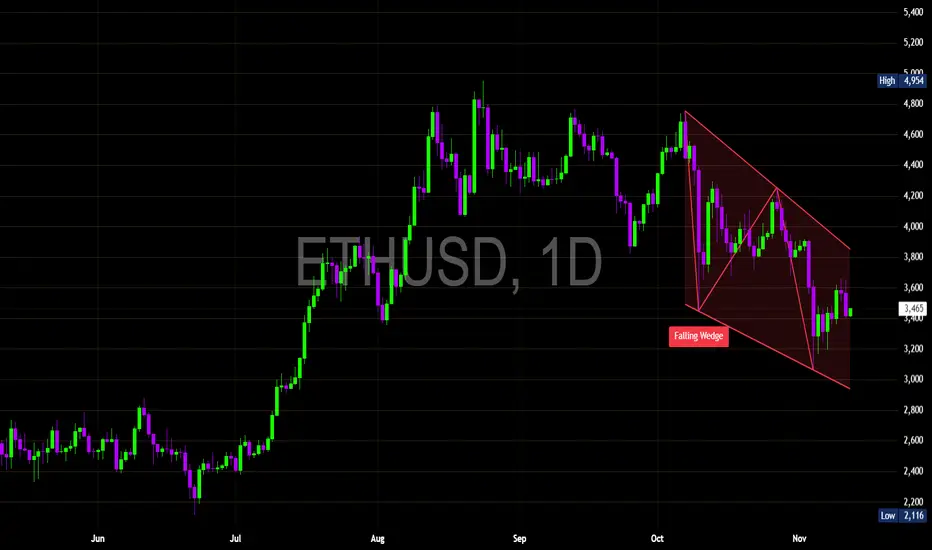
#Ethereum has been consolidating within a Falling Wedge pattern since early October — a structure that often precedes a bullish reversal when confirmed with volume.
The wedge is tightening between $3,200 support and $3,700 resistance, forming lower highs and higher lows within a descending channel.
Historically, such formations break to the upside once selling pressure exhausts.
🔸️Support Zone: $3,200 → $3,000
🔹️Resistance Zone: $3,700 → $3,850
🔸️Breakout Confirmation: Daily close above $3,850 with rising volume may trigger a push toward $4,200 – $4,600, aligning with the top of the previous consolidation range.
🔹️Invalidation: Breakdown below $3,000 would signal extended downside toward $2,800.
#ETH is coiling inside a Falling Wedge, with bulls preparing to reclaim momentum if resistance breaks. A successful breakout could ignite a mid-term rally — but failure to hold $3,200 could extend the correction.
Penafian
Maklumat dan penerbitan adalah tidak bertujuan, dan tidak membentuk, nasihat atau cadangan kewangan, pelaburan, dagangan atau jenis lain yang diberikan atau disahkan oleh TradingView. Baca lebih dalam Terma Penggunaan.
Penafian
Maklumat dan penerbitan adalah tidak bertujuan, dan tidak membentuk, nasihat atau cadangan kewangan, pelaburan, dagangan atau jenis lain yang diberikan atau disahkan oleh TradingView. Baca lebih dalam Terma Penggunaan.