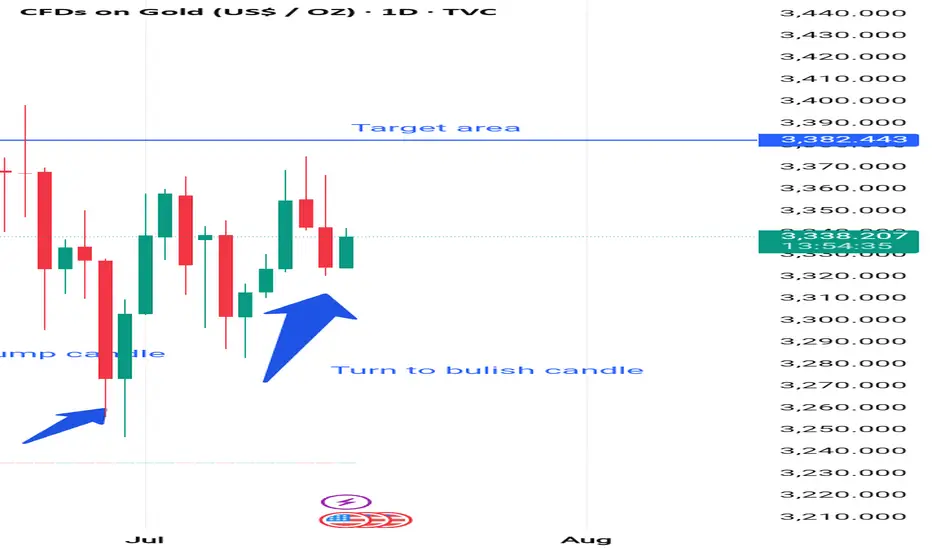
Key Observations:
✅ Current Price:
Gold is trading at $3,338.970, up $14.753 (+0.44%).
📈 Target Area:
A blue line is drawn at $3,382.443, indicating a target resistance area — likely where the trader expects the price to move.
📉 Recent Price Action:
The chart shows a series of red and green candles, indicating fluctuations with a recent bullish candle (green).
🔵 Annotated Points:
1. "Bullish pump candle" (end of June):
A strong bullish (green) candle pushing price upward.
2. "Turn to bullish candle" (early-mid July):
After a decline, the trend seems to shift back to bullish again.
📊 Technical Insight:
Higher lows are forming, indicating potential bullish momentum.
Price is moving upward again toward the target resistance area.
Previous attempts to break that $3,382 area have failed (note the wicks above the line), suggesting it's a strong resistance.
---
📌 Conclusion / Possible Strategy:
Bullish Bias: The chart implies a bullish trend is forming or resuming.
Target: $3,382.443 is the short-term target.
Confirmation Needed: A strong bullish candle closing above that resistance would confirm a breakout.
Risk Zone: If price reverses before hitting $3,382 or forms a bearish engulfing candle, a pullback may occur.
Penafian
Maklumat dan penerbitan adalah tidak dimaksudkan untuk menjadi, dan tidak membentuk, nasihat untuk kewangan, pelaburan, perdagangan dan jenis-jenis lain atau cadangan yang dibekalkan atau disahkan oleh TradingView. Baca dengan lebih lanjut di Terma Penggunaan.
Penafian
Maklumat dan penerbitan adalah tidak dimaksudkan untuk menjadi, dan tidak membentuk, nasihat untuk kewangan, pelaburan, perdagangan dan jenis-jenis lain atau cadangan yang dibekalkan atau disahkan oleh TradingView. Baca dengan lebih lanjut di Terma Penggunaan.