Technical Analysis
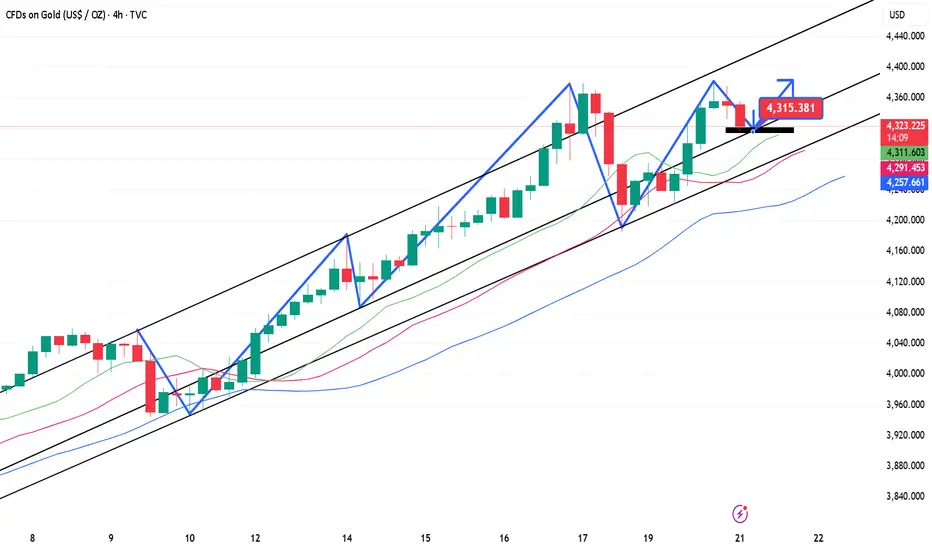
The 4-hour MACD formed a death cross with shrinking volume, converging and flattening, indicating current volatility. The 4-hour candlestick chart also closed at a high level with a small Yin-Yang candlestick. The question now remains whether the candlestick chart will rise directly or retrace to the middle line near 4292. A direct rise would not fall below the morning's low of 4332.
The hourly chart began to fluctuate and decline after trading sideways this morning. Currently, attention is focused on support near 4332. The hourly MACD formed a golden cross with shrinking volume, and the STO indicator corrected downward, indicating a potential decline in the hourly chart. Current support on the hourly chart lies around 4332-4327 and 4302.
In summary:
The daily chart suggests today's decline is not over, and will likely reach at least 4300. The question now remains whether the 4-hour chart will fluctuate at a high level or rise directly. A direct rise would likely lead to a continued rise to around 4420, while consolidation at a high level would likely lead to a decline. Therefore, a short position around 4372-4377 is feasible. As for long orders, they need to be placed near 4267-4275, and the first long order can be placed near 4296-97.
Strategy:
[1] Short near 4368-70, defend 4382, target 4335-4300-4270
[2] Long near 4296-97 below, defend 4290, target 4330
[3] Long near 4268-72 intraday, defend 4262, target 4300-4330-4370, etc.
Breaking above 4382 will directly lead to the 4410-4420-4480 line, so if it breaks above 4382 and then falls back to 4370, go long.
Like
Dagangan aktif
Hold the key points and wait patiently for the key points to enter the marketThe road to success is not crowded. As long as you choose the right direction and follow the right team, you will be able to move forward.
t.me/david_456654
t.me/david_456654
Penerbitan berkaitan
Penafian
Maklumat dan penerbitan adalah tidak dimaksudkan untuk menjadi, dan tidak membentuk, nasihat untuk kewangan, pelaburan, perdagangan dan jenis-jenis lain atau cadangan yang dibekalkan atau disahkan oleh TradingView. Baca dengan lebih lanjut di Terma Penggunaan.
The road to success is not crowded. As long as you choose the right direction and follow the right team, you will be able to move forward.
t.me/david_456654
t.me/david_456654
Penerbitan berkaitan
Penafian
Maklumat dan penerbitan adalah tidak dimaksudkan untuk menjadi, dan tidak membentuk, nasihat untuk kewangan, pelaburan, perdagangan dan jenis-jenis lain atau cadangan yang dibekalkan atau disahkan oleh TradingView. Baca dengan lebih lanjut di Terma Penggunaan.