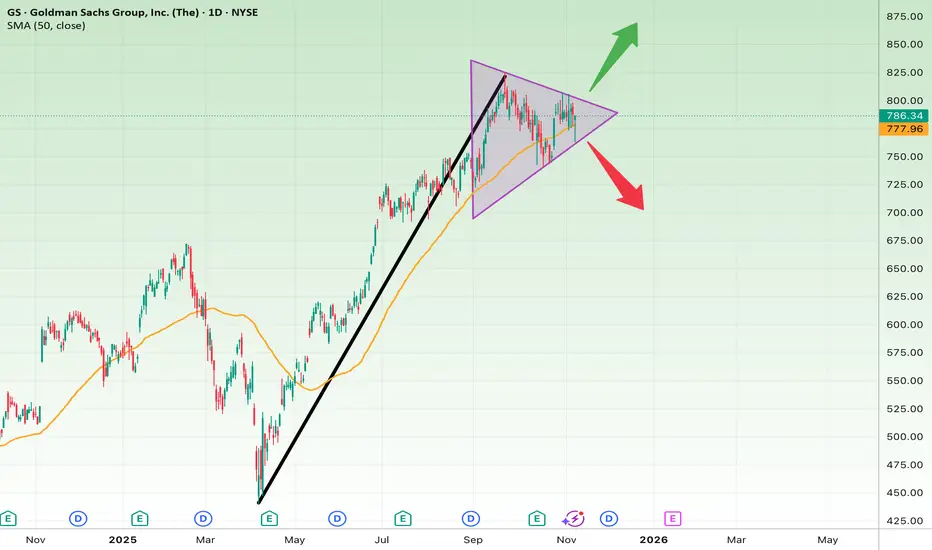
After a strong rally from around $525 to near $820, GS has entered a symmetrical triangle consolidation pattern. This type of formation often signals that a major move is coming once the breakout direction is confirmed.
The 50-day SMA (currently around $778) is acting as dynamic support.
Short-Term View (1–3 weeks):
• A confirmed breakout above the descending trendline (~$800) would signal bullish continuation.
• Short-term target: $830–$850
• Stop-loss: below $770
Long-Term View (1–3 months):
• A breakout to the upside would likely extend the prior uptrend.
• Long-term target: $900–$940
• A breakdown below $760 could trigger a correction toward $700 or even $650.
Summary:
GS is coiling within a key triangle — a breakout will likely define the next big move. Bulls are watching $800, while bears are eyeing $760 for confirmation.
Penafian
Maklumat dan penerbitan adalah tidak bertujuan, dan tidak membentuk, nasihat atau cadangan kewangan, pelaburan, dagangan atau jenis lain yang diberikan atau disahkan oleh TradingView. Baca lebih dalam Terma Penggunaan.
Penafian
Maklumat dan penerbitan adalah tidak bertujuan, dan tidak membentuk, nasihat atau cadangan kewangan, pelaburan, dagangan atau jenis lain yang diberikan atau disahkan oleh TradingView. Baca lebih dalam Terma Penggunaan.