Detailed Market Structure Breakdown
4-Hour Chart (Macro Trend)
Structure: The Sensex is now in a Corrective Phase within its broader uptrend. The price broke out of the ascending channel in the morning but was aggressively rejected from the 85,300 - 85,600 supply zone (recent high). The final 4H candle is a large bearish candle, confirming the Market Structure Shift (MSS) to the downside. The price closed right on the lower trendline of the corrective pattern.
Key Levels:
Major Supply (Resistance): 85,000 - 85,300. This area (the high of the breakdown and psychological mark) is the immediate overhead resistance.
Major Demand (Support): 84,200 - 84,400. This area, which includes the lower trendline of the current corrective pattern and a strong FVG (Fair Value Gap), is the must-hold zone for the medium-term rally.
Outlook: The short-term bias is Bearish. The sharp reversal suggests strong profit-booking, and the market is likely to seek lower support levels.
1-Hour Chart (Intermediate View)
Structure: The 1H chart clearly shows the massive selling pressure that followed the failure at the high. The price has broken below the 9-period EMA and the lower trendline of the immediate ascending channel. The market is now trading right above the 84,400 support.
Key Levels:
Immediate Resistance: 85,000 (The breakdown level/FVG).
Immediate Support: 84,200 - 84,400.
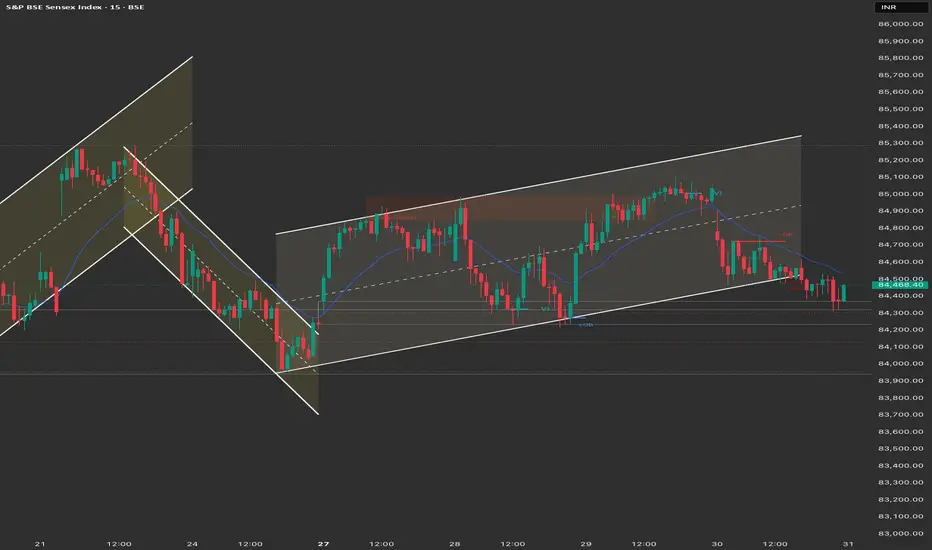
15-Minute Chart (Intraday View)
Structure: The 15M chart confirms the steep descending channel formed during the correction. The market closed near its low, breaking below the immediate swing low and confirming intraday bearish control.
Key Levels:
Intraday Supply: 84,800 (Upper channel trendline).
Intraday Demand: 84,200.
Outlook: Strongly Bearish for the session open. A "Sell on Rise" strategy is highly favored.
📈 Structure Analysis & Trade Plan: 31st October
Market Outlook: The Sensex witnessed an aggressive reversal after failing to break the recent high. The US Federal Reserve decision (post-market yesterday) will introduce high volatility. The primary strategy is to sell the breakdown or sell into any weak rise.
Bearish Scenario (Primary Plan: Correction Continuation)
Justification: The aggressive rejection from the supply zone and the breakdown of the short-term bullish structure favor continuation toward the main FVG support.
Entry: Short entry on a decisive break and 15-minute candle close below 84,200. Alternatively, short a retest and rejection of the 84,800 level (upper channel/FVG).
Stop Loss (SL): Place a stop loss above 85,300 (above the high of the breakdown).
Targets:
T1: 83,800 (Lower channel support/FVG).
T2: 83,600 (Major FVG demand zone).
Bullish Scenario (Counter-Trend/Reversal)
Justification: Only valid if the Fed decision was extremely dovish, leading to a strong gap-up that negates the current selling structure.
Trigger: A sustained move and close above 85,300.
Entry: Long entry on a confirmed 15-minute close above 85,300.
Stop Loss (SL): Below 84,800.
Targets:
T1: 85,600 (Upper channel boundary).
T2: 86,000 (All-Time High retest).
Key Levels for Observation:
Immediate Decision Point: 84,200 - 84,800 zone.
Bearish Confirmation: Sustained trade below 84,200.
Bullish Warning: A move back above 85,000.
Line in the Sand: 84,200. Below this level, the short-term bullish bias is strongly bearish.
4-Hour Chart (Macro Trend)
Structure: The Sensex is now in a Corrective Phase within its broader uptrend. The price broke out of the ascending channel in the morning but was aggressively rejected from the 85,300 - 85,600 supply zone (recent high). The final 4H candle is a large bearish candle, confirming the Market Structure Shift (MSS) to the downside. The price closed right on the lower trendline of the corrective pattern.
Key Levels:
Major Supply (Resistance): 85,000 - 85,300. This area (the high of the breakdown and psychological mark) is the immediate overhead resistance.
Major Demand (Support): 84,200 - 84,400. This area, which includes the lower trendline of the current corrective pattern and a strong FVG (Fair Value Gap), is the must-hold zone for the medium-term rally.
Outlook: The short-term bias is Bearish. The sharp reversal suggests strong profit-booking, and the market is likely to seek lower support levels.
1-Hour Chart (Intermediate View)
Structure: The 1H chart clearly shows the massive selling pressure that followed the failure at the high. The price has broken below the 9-period EMA and the lower trendline of the immediate ascending channel. The market is now trading right above the 84,400 support.
Key Levels:
Immediate Resistance: 85,000 (The breakdown level/FVG).
Immediate Support: 84,200 - 84,400.
15-Minute Chart (Intraday View)
Structure: The 15M chart confirms the steep descending channel formed during the correction. The market closed near its low, breaking below the immediate swing low and confirming intraday bearish control.
Key Levels:
Intraday Supply: 84,800 (Upper channel trendline).
Intraday Demand: 84,200.
Outlook: Strongly Bearish for the session open. A "Sell on Rise" strategy is highly favored.
📈 Structure Analysis & Trade Plan: 31st October
Market Outlook: The Sensex witnessed an aggressive reversal after failing to break the recent high. The US Federal Reserve decision (post-market yesterday) will introduce high volatility. The primary strategy is to sell the breakdown or sell into any weak rise.
Bearish Scenario (Primary Plan: Correction Continuation)
Justification: The aggressive rejection from the supply zone and the breakdown of the short-term bullish structure favor continuation toward the main FVG support.
Entry: Short entry on a decisive break and 15-minute candle close below 84,200. Alternatively, short a retest and rejection of the 84,800 level (upper channel/FVG).
Stop Loss (SL): Place a stop loss above 85,300 (above the high of the breakdown).
Targets:
T1: 83,800 (Lower channel support/FVG).
T2: 83,600 (Major FVG demand zone).
Bullish Scenario (Counter-Trend/Reversal)
Justification: Only valid if the Fed decision was extremely dovish, leading to a strong gap-up that negates the current selling structure.
Trigger: A sustained move and close above 85,300.
Entry: Long entry on a confirmed 15-minute close above 85,300.
Stop Loss (SL): Below 84,800.
Targets:
T1: 85,600 (Upper channel boundary).
T2: 86,000 (All-Time High retest).
Key Levels for Observation:
Immediate Decision Point: 84,200 - 84,800 zone.
Bearish Confirmation: Sustained trade below 84,200.
Bullish Warning: A move back above 85,000.
Line in the Sand: 84,200. Below this level, the short-term bullish bias is strongly bearish.
Penafian
Maklumat dan penerbitan adalah tidak dimaksudkan untuk menjadi, dan tidak membentuk, nasihat untuk kewangan, pelaburan, perdagangan dan jenis-jenis lain atau cadangan yang dibekalkan atau disahkan oleh TradingView. Baca dengan lebih lanjut di Terma Penggunaan.
Penafian
Maklumat dan penerbitan adalah tidak dimaksudkan untuk menjadi, dan tidak membentuk, nasihat untuk kewangan, pelaburan, perdagangan dan jenis-jenis lain atau cadangan yang dibekalkan atau disahkan oleh TradingView. Baca dengan lebih lanjut di Terma Penggunaan.