🟩
SKYGOLD (15M) | NSE | Heikin Ashi
🟢 LONG BIAS
📅 Updated: July 17
---
🔍 Description
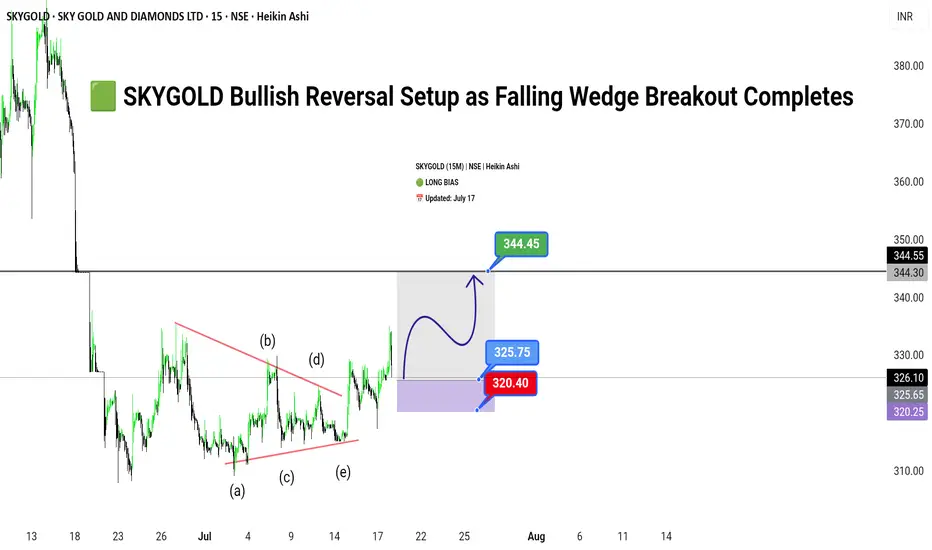
SKYGOLD has emerged from a prolonged corrective phase, breaking out of a well-defined falling wedge pattern on the 15-minute chart. The price action has respected a clean Elliott Wave ABCDE structure within the wedge, suggesting a completed consolidation cycle. With bullish momentum building above ₹325, the stock now appears poised for a breakout rally towards ₹344.45.
This setup reflects both a technical breakout and possible short-covering rally, making it an attractive opportunity for short-term swing traders. However, risk remains below the ₹320.40 zone, which invalidates the breakout structure if breached.
---
📊 Technical Structure (15M)
✅ Breakout above wedge resistance
✅ ABCDE wave structure complete (classic consolidation)
✅ Impulse targets in sight
📌 Upside Targets
First: ₹325.75
Final: ₹344.45
🔻 Risk Zone
Below: ₹320.40 (Breakdown invalidates setup)
---
📈 Fundamental/Flow Highlights
Sector Sentiment: Positive traction in mid-cap jewellery and gems segment.
Volume Spike: Notable rise in volume on breakout candle.
Short-Covering Potential: Highly likely due to prolonged consolidation.
---
⚠️ Risks to Watch
Sudden broad market correction in Nifty Midcap segment.
Lack of follow-through volume post-breakout.
Intraday rejection near ₹344 zone (previous supply).
---
🧭 Summary: Bias and Watchpoints
SKYGOLD is bullish above ₹325 with a breakout structure favoring continued upside toward ₹344.45. As long as the price holds above ₹320.40, the long thesis remains valid. Watch volume confirmation, and use trailing SL to lock gains.
SKYGOLD (15M) | NSE | Heikin Ashi
🟢 LONG BIAS
📅 Updated: July 17
---
🔍 Description
SKYGOLD has emerged from a prolonged corrective phase, breaking out of a well-defined falling wedge pattern on the 15-minute chart. The price action has respected a clean Elliott Wave ABCDE structure within the wedge, suggesting a completed consolidation cycle. With bullish momentum building above ₹325, the stock now appears poised for a breakout rally towards ₹344.45.
This setup reflects both a technical breakout and possible short-covering rally, making it an attractive opportunity for short-term swing traders. However, risk remains below the ₹320.40 zone, which invalidates the breakout structure if breached.
---
📊 Technical Structure (15M)
✅ Breakout above wedge resistance
✅ ABCDE wave structure complete (classic consolidation)
✅ Impulse targets in sight
📌 Upside Targets
First: ₹325.75
Final: ₹344.45
🔻 Risk Zone
Below: ₹320.40 (Breakdown invalidates setup)
---
📈 Fundamental/Flow Highlights
Sector Sentiment: Positive traction in mid-cap jewellery and gems segment.
Volume Spike: Notable rise in volume on breakout candle.
Short-Covering Potential: Highly likely due to prolonged consolidation.
---
⚠️ Risks to Watch
Sudden broad market correction in Nifty Midcap segment.
Lack of follow-through volume post-breakout.
Intraday rejection near ₹344 zone (previous supply).
---
🧭 Summary: Bias and Watchpoints
SKYGOLD is bullish above ₹325 with a breakout structure favoring continued upside toward ₹344.45. As long as the price holds above ₹320.40, the long thesis remains valid. Watch volume confirmation, and use trailing SL to lock gains.
Penafian
Maklumat dan penerbitan adalah tidak dimaksudkan untuk menjadi, dan tidak membentuk, nasihat untuk kewangan, pelaburan, perdagangan dan jenis-jenis lain atau cadangan yang dibekalkan atau disahkan oleh TradingView. Baca dengan lebih lanjut di Terma Penggunaan.
Penafian
Maklumat dan penerbitan adalah tidak dimaksudkan untuk menjadi, dan tidak membentuk, nasihat untuk kewangan, pelaburan, perdagangan dan jenis-jenis lain atau cadangan yang dibekalkan atau disahkan oleh TradingView. Baca dengan lebih lanjut di Terma Penggunaan.