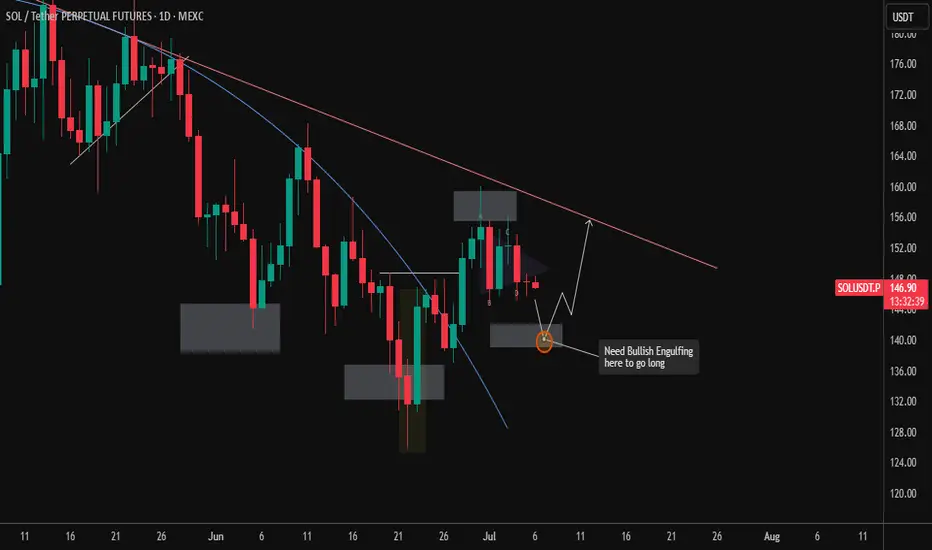
The daily chart of SOLUSDT Perpetual Futures (MEXC) is currently showing signs of a potential reversal setup, but confirmation is key before taking a long position.
🔍 Chart Overview:
Price action is in a clear downtrend, with lower highs forming consistently, capped by a descending trendline.
We’ve recently seen a pullback after a failed breakout near the $152–$154 region.
📌 Key Zone to Watch:
A demand zone around $137–$140 is marked, which previously acted as a springboard for bullish movement.
There's a confluence of this demand zone with the wedge breakout retest area.
📈 Trade Setup & Plan:
The chart notes: "Need Bullish Engulfing here to go long".
This implies a waiting strategy: look for a strong bullish engulfing candle at the $137–$140 zone before entering a long position.
If confirmed, price could rally back toward the descending trendline near $150–$154, which aligns with the prior resistance level.
⚠️ Invalidation:
A daily close below $135 would invalidate the bullish setup and likely trigger continuation toward $128–$130 support area.
📊 Summary:
Bias: Cautiously Bullish (Waiting for confirmation)
Entry Trigger: Bullish engulfing candle at $137–$140
Target: $152–$154
Invalidation Level: Below $135
Patience is key here. Let the price come to you and confirm intent before jumping in.
Penafian
Maklumat dan penerbitan adalah tidak dimaksudkan untuk menjadi, dan tidak membentuk, nasihat untuk kewangan, pelaburan, perdagangan dan jenis-jenis lain atau cadangan yang dibekalkan atau disahkan oleh TradingView. Baca dengan lebih lanjut di Terma Penggunaan.
Penafian
Maklumat dan penerbitan adalah tidak dimaksudkan untuk menjadi, dan tidak membentuk, nasihat untuk kewangan, pelaburan, perdagangan dan jenis-jenis lain atau cadangan yang dibekalkan atau disahkan oleh TradingView. Baca dengan lebih lanjut di Terma Penggunaan.