US100 – 4H Technical Zone Analysis
Overall, it remains challenging to define high-probability trading zones in the current environment. Price action is taking place near all-time highs, where volatility is elevated and historical reference points are limited. With sentiment shifting rapidly on macro headlines and thin data visibility, traders should treat each reaction zone with caution and focus on confirmation rather than anticipation.
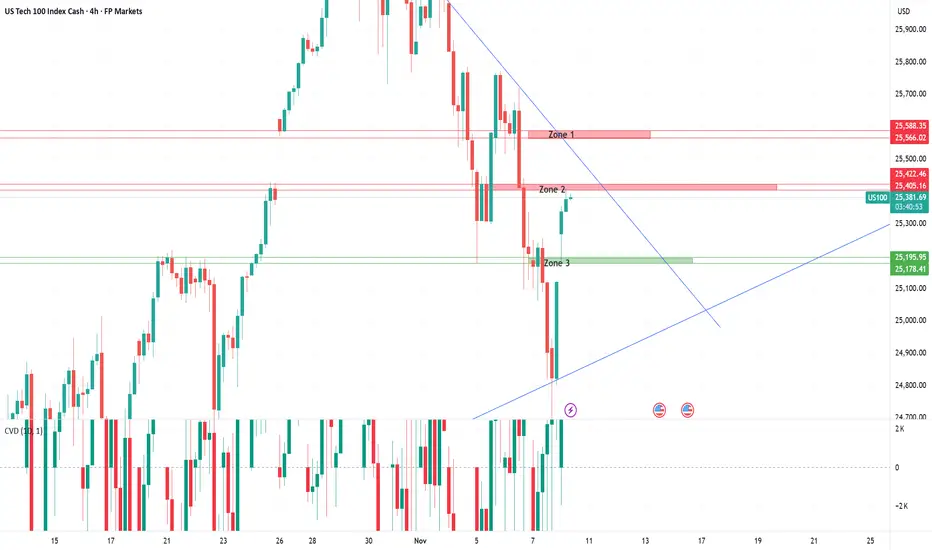
Zone 1: Former Demand Turned Resistance
This area previously attracted strong buying interest, but sellers have since regained control, forcing price back below the level. The zone now acts as a clear resistance area where supply is likely to re-emerge. A confirmed rejection here would reinforce short-term bearish structure, while a clean break and hold above could signal that buyers are reclaiming dominance.
Zone 2: Minor Reaction Zone / Potential Supply Area
This zone represents a less-defined reaction area where a previous price gap formed, suggesting potential for renewed selling pressure if price revisits it. However, given the lack of strong historical structure, traders should approach this zone with caution and look for clear confirmation before positioning around it.
Zone 3: Former Supply Turned Support
This level previously acted as a ceiling where sellers pushed price lower before a decisive breakout occurred. Since that move, the area has flipped into a supportive base, marking the first meaningful demand zone beneath current price. As long as price holds above Zone 3, the broader structure remains constructive; a confirmed break below would indicate that buyers are losing control.
Macro Overview
The Nasdaq-100 continues to trade near record highs, supported by a mix of resilient economic data, easing inflation pressures, and improving global risk sentiment. The broader tone remains constructively bullish, though investors are increasingly aware that the rally is being sustained more by optimism than by hard data.
Last week’s key drivers included renewed progress in U.S.–China trade talks and a strong set of tech earnings, which reinforced confidence in the growth and AI-led segments of the market. Softer-than-expected inflation readings added fuel to the rally by reviving expectations of potential Fed rate cuts in early 2026. However, policymakers have since pushed back on those assumptions, warning that rate reductions are not guaranteed and that the central bank will remain data-dependent.
At the same time, the ongoing partial U.S. government shutdown continues to delay key macro releases such as employment and CPI reports, leaving both investors and policymakers with limited visibility. This data vacuum makes markets unusually sensitive to headlines and Fed commentary.
Overall, it remains challenging to define high-probability trading zones in the current environment. Price action is taking place near all-time highs, where volatility is elevated and historical reference points are limited. With sentiment shifting rapidly on macro headlines and thin data visibility, traders should treat each reaction zone with caution and focus on confirmation rather than anticipation.
Zone 1: Former Demand Turned Resistance
This area previously attracted strong buying interest, but sellers have since regained control, forcing price back below the level. The zone now acts as a clear resistance area where supply is likely to re-emerge. A confirmed rejection here would reinforce short-term bearish structure, while a clean break and hold above could signal that buyers are reclaiming dominance.
Zone 2: Minor Reaction Zone / Potential Supply Area
This zone represents a less-defined reaction area where a previous price gap formed, suggesting potential for renewed selling pressure if price revisits it. However, given the lack of strong historical structure, traders should approach this zone with caution and look for clear confirmation before positioning around it.
Zone 3: Former Supply Turned Support
This level previously acted as a ceiling where sellers pushed price lower before a decisive breakout occurred. Since that move, the area has flipped into a supportive base, marking the first meaningful demand zone beneath current price. As long as price holds above Zone 3, the broader structure remains constructive; a confirmed break below would indicate that buyers are losing control.
Macro Overview
The Nasdaq-100 continues to trade near record highs, supported by a mix of resilient economic data, easing inflation pressures, and improving global risk sentiment. The broader tone remains constructively bullish, though investors are increasingly aware that the rally is being sustained more by optimism than by hard data.
Last week’s key drivers included renewed progress in U.S.–China trade talks and a strong set of tech earnings, which reinforced confidence in the growth and AI-led segments of the market. Softer-than-expected inflation readings added fuel to the rally by reviving expectations of potential Fed rate cuts in early 2026. However, policymakers have since pushed back on those assumptions, warning that rate reductions are not guaranteed and that the central bank will remain data-dependent.
At the same time, the ongoing partial U.S. government shutdown continues to delay key macro releases such as employment and CPI reports, leaving both investors and policymakers with limited visibility. This data vacuum makes markets unusually sensitive to headlines and Fed commentary.
Penafian
The information and publications are not meant to be, and do not constitute, financial, investment, trading, or other types of advice or recommendations supplied or endorsed by TradingView. Read more in the Terms of Use.
Penafian
The information and publications are not meant to be, and do not constitute, financial, investment, trading, or other types of advice or recommendations supplied or endorsed by TradingView. Read more in the Terms of Use.