OPEN-SOURCE SCRIPT
Telah dikemas kini ARVELOV MACD with Zones
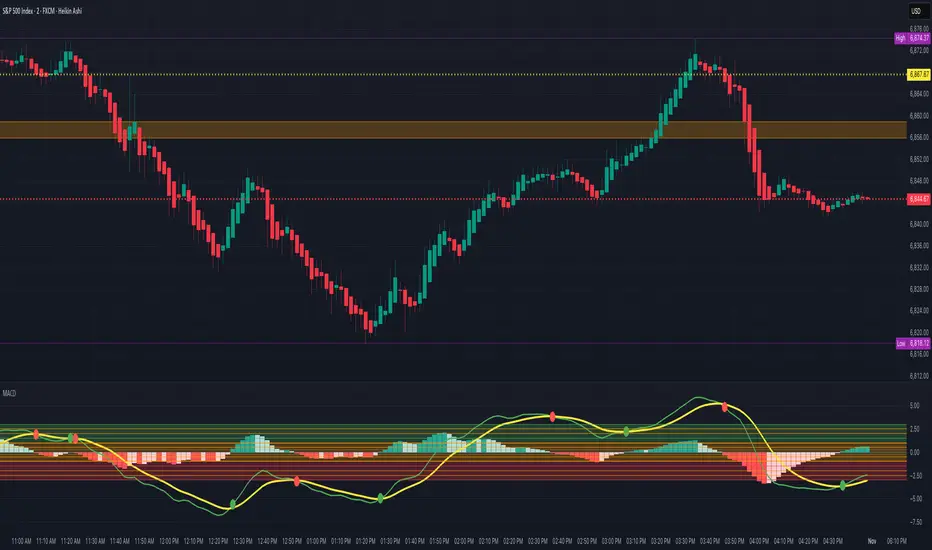
This TradingView Pine Script (version 5) is a custom MACD (Moving Average Convergence Divergence) indicator. It calculates the MACD line by subtracting a slow moving average from a fast moving average, using either an EMA or SMA depending on user settings. A signal line—also selectable as an EMA or SMA—is then derived from the MACD, and the histogram plots the difference between the two. The script visually enhances the traditional MACD by coloring the histogram columns dynamically: shades of green for strengthening bullish momentum and shades of red for weakening or strengthening bearish momentum.
Beyond standard MACD plotting, the script adds multiple horizontal reference lines (from ±0.25 up to ±3) and color-filled zones to highlight momentum regions: an orange box for the neutral range (−1 to +1), a red zone for strong bearish momentum (−3 to −1), and a green zone for strong bullish momentum (+1 to +3). It includes alerts and visual dots for key events—when the MACD crosses its signal line (bullish or bearish crossovers) and when the histogram changes slope (rising to falling or vice versa). Altogether, this enhanced MACD aims to make momentum shifts and overextended conditions easier to identify visually and programmatically for alert-based trading strategies.
Beyond standard MACD plotting, the script adds multiple horizontal reference lines (from ±0.25 up to ±3) and color-filled zones to highlight momentum regions: an orange box for the neutral range (−1 to +1), a red zone for strong bearish momentum (−3 to −1), and a green zone for strong bullish momentum (+1 to +3). It includes alerts and visual dots for key events—when the MACD crosses its signal line (bullish or bearish crossovers) and when the histogram changes slope (rising to falling or vice versa). Altogether, this enhanced MACD aims to make momentum shifts and overextended conditions easier to identify visually and programmatically for alert-based trading strategies.
Nota Keluaran
This TradingView Pine Script (version 5) is a custom MACD (Moving Average Convergence Divergence) indicator. It calculates the MACD line by subtracting a slow moving average from a fast moving average, using either an EMA or SMA depending on user settings. A signal line—also selectable as an EMA or SMA—is then derived from the MACD, and the histogram plots the difference between the two. The script visually enhances the traditional MACD by coloring the histogram columns dynamically: shades of green for strengthening bullish momentum and shades of red for weakening or strengthening bearish momentum.Beyond standard MACD plotting, the script adds multiple horizontal reference lines (from ±0.25 up to ±3) and color-filled zones to highlight momentum regions: an orange box for the neutral range (−1 to +1), a red zone for strong bearish momentum (−3 to −1), and a green zone for strong bullish momentum (+1 to +3). It includes alerts and visual dots for key events—when the MACD crosses its signal line (bullish or bearish crossovers) and when the histogram changes slope (rising to falling or vice versa). Altogether, this enhanced MACD aims to make momentum shifts and overextended conditions easier to identify visually and programmatically for alert-based trading strategies.
Skrip sumber terbuka
Dalam semangat sebenar TradingView, pencipta skrip ini telah menjadikannya sumber terbuka supaya pedagang dapat menilai dan mengesahkan kefungsiannya. Terima kasih kepada penulis! Walaupun anda boleh menggunakannya secara percuma, ingat bahawa menerbitkan semula kod ini adalah tertakluk kepada Peraturan Dalaman kami.
Penafian
Maklumat dan penerbitan adalah tidak dimaksudkan untuk menjadi, dan tidak membentuk, nasihat untuk kewangan, pelaburan, perdagangan dan jenis-jenis lain atau cadangan yang dibekalkan atau disahkan oleh TradingView. Baca dengan lebih lanjut di Terma Penggunaan.