PROTECTED SOURCE SCRIPT
TRADE ORBIT:-Institutional FOOTPRINT
BUY WHEN:
✅ Green position building zone
✅ Multiple strong buy signals
✅ Volume ratio > 2.0x
✅ Signal strength 6-7/7
✅ No bearish divergence
SELL WHEN:
🔴 Red position exiting zone
🔴 Multiple strong sell signals
🔴 Volume spike on down bars
🔴 Signal strength 6-7/7
🔴 No bullish divergence
WAIT WHEN:
⚠️ Conflicting signals
⚠️ Low volume
⚠️ Signal strength < 4/7
⚠️ Sideways market
COMMON MISTAKES TO AVOID
Don't trade on single signals
Don't ignore the overall trend
Don't overlook divergence signals
Always check volume confirmation
Wait for multiple time frame confirmation
PERFECT BUY SETUP:
Chart shows green background (position building)
Large green triangles appear below bars
Table shows:
Volume Ratio: 2.5x ✅
Signal: STRONG BUY ✅
Position Status: BUILDING ✅
Market Trend: BULLISH ✅
Signal Strength: 7/7 ✅
Price above VWAP and rising OBV
DANGER SELL SETUP:
Chart shows red background (position exiting)
Large red triangles appear above bars
Table shows:
Signal: STRONG SELL ✅
Position Status: EXITING ✅
Money Flow: NEGATIVE ✅
Bearish divergence present ✅
TIME FRAMES:
Best: Daily charts (most accurate for institutional detection)
Good: 4-hour and Weekly charts
For confirmation: Use multiple time frames
CONFIRMATION RULES:
Never trade on a single signal alone
Look for clusters of signals
Check signal strength (5-7/7 is strong)
Ensure trend alignment (don't fight the trend)
Watch for divergence as early warnings
RISK MANAGEMENT:
Entry: After 2-3 confirming signals in same direction
Stop Loss: Below recent support for buys, above resistance for sells
Position Size: Smaller during conflicting signals, larger during high confirmation
Recommended Alerts:
Strong Institutional Buying - For entry opportunities
Strong Institutional Selling - For exit warnings
Position Building - For accumulation phases
Position Exiting - For distribution phases
Bullish Divergence - Early accumulation signals
Bearish Divergence - Early distribution signals
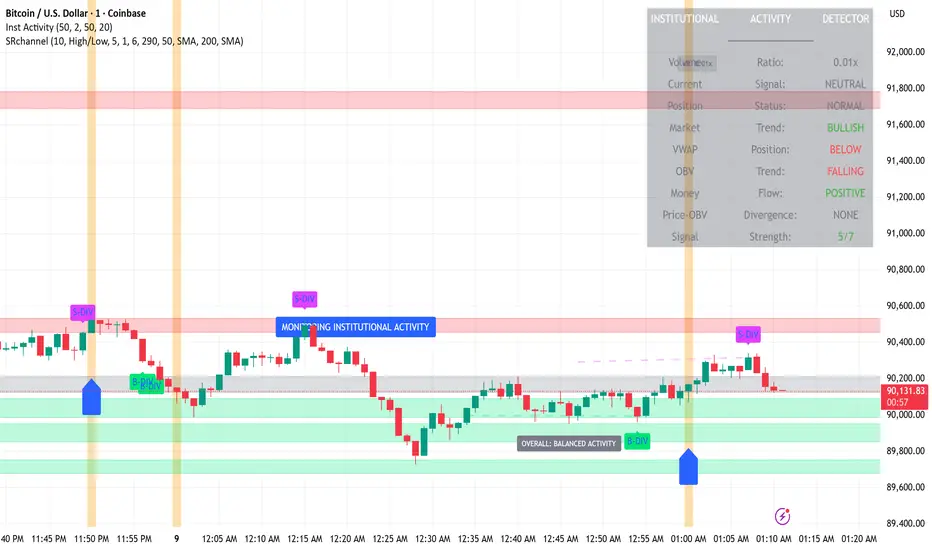
BACKGROUND COLORS:
🔵 Blue background = High volume spike (2x+ average)
🟢 Green background = Position building zone (cluster of buys)
🔴 Red background = Position exiting zone (cluster of sells)
DIVERGENCE SIGNALS:
B-DIV = Bullish divergence (price low, OBV high = accumulation)
S-DIV = Bearish divergence (price high, OBV low = distribution)
✅ Green position building zone
✅ Multiple strong buy signals
✅ Volume ratio > 2.0x
✅ Signal strength 6-7/7
✅ No bearish divergence
SELL WHEN:
🔴 Red position exiting zone
🔴 Multiple strong sell signals
🔴 Volume spike on down bars
🔴 Signal strength 6-7/7
🔴 No bullish divergence
WAIT WHEN:
⚠️ Conflicting signals
⚠️ Low volume
⚠️ Signal strength < 4/7
⚠️ Sideways market
COMMON MISTAKES TO AVOID
Don't trade on single signals
Don't ignore the overall trend
Don't overlook divergence signals
Always check volume confirmation
Wait for multiple time frame confirmation
PERFECT BUY SETUP:
Chart shows green background (position building)
Large green triangles appear below bars
Table shows:
Volume Ratio: 2.5x ✅
Signal: STRONG BUY ✅
Position Status: BUILDING ✅
Market Trend: BULLISH ✅
Signal Strength: 7/7 ✅
Price above VWAP and rising OBV
DANGER SELL SETUP:
Chart shows red background (position exiting)
Large red triangles appear above bars
Table shows:
Signal: STRONG SELL ✅
Position Status: EXITING ✅
Money Flow: NEGATIVE ✅
Bearish divergence present ✅
TIME FRAMES:
Best: Daily charts (most accurate for institutional detection)
Good: 4-hour and Weekly charts
For confirmation: Use multiple time frames
CONFIRMATION RULES:
Never trade on a single signal alone
Look for clusters of signals
Check signal strength (5-7/7 is strong)
Ensure trend alignment (don't fight the trend)
Watch for divergence as early warnings
RISK MANAGEMENT:
Entry: After 2-3 confirming signals in same direction
Stop Loss: Below recent support for buys, above resistance for sells
Position Size: Smaller during conflicting signals, larger during high confirmation
Recommended Alerts:
Strong Institutional Buying - For entry opportunities
Strong Institutional Selling - For exit warnings
Position Building - For accumulation phases
Position Exiting - For distribution phases
Bullish Divergence - Early accumulation signals
Bearish Divergence - Early distribution signals
BACKGROUND COLORS:
🔵 Blue background = High volume spike (2x+ average)
🟢 Green background = Position building zone (cluster of buys)
🔴 Red background = Position exiting zone (cluster of sells)
DIVERGENCE SIGNALS:
B-DIV = Bullish divergence (price low, OBV high = accumulation)
S-DIV = Bearish divergence (price high, OBV low = distribution)
Skrip dilindungi
Skrip ini diterbitkan sebagai sumber tertutup. Akan tetapi, anda boleh menggunakannya secara bebas dan tanpa apa-apa had – ketahui lebih di sini.
Penafian
Maklumat dan penerbitan adalah tidak bertujuan, dan tidak membentuk, nasihat atau cadangan kewangan, pelaburan, dagangan atau jenis lain yang diberikan atau disahkan oleh TradingView. Baca lebih dalam Terma Penggunaan.