![]()
Matrices
- Introduction
- Declaring a matrix
- Reading and writing matrix elements
- Rows and columns
- Looping through a matrix
- Copying a matrix
- Scope and history
- Inspecting a matrix
- Manipulating a matrix
- Matrix calculations
- Error handling
- The row/column index (xx) is out of bounds, row/column size is (yy).
- The array size does not match the number of rows/columns in the matrix.
- Cannot call matrix methods when the ID of matrix is ‘na’.
- Matrix is too large. Maximum size of the matrix is 100,000 elements.
- The row/column index must be 0 <= from_row/column < to_row/column.
- Matrices ‘id1’ and ‘id2’ must have an equal number of rows and columns to be added.
- The number of columns in the ‘id1’ matrix must equal the number of rows in the matrix (or the number of elements in the array) ‘id2’.
- Operation not available for non-square matrices.
Note
This page contains advanced material. If you are a beginning Pine Script™ programmer, we recommend you become familiar with other, more accessible Pine Script™ features before you venture here.
Introduction
Pine Script™ Matrices are collections that store value references in a rectangular format. They are essentially the equivalent of two-dimensional array objects with functions and methods for inspection, modification, and specialized calculations. As with arrays, all matrix elements must be of the same type, which can be a built-in or a user-defined type.
Matrices reference their elements using two indices: one index for their rows and the other for their columns. Each index starts at 0 and extends to the number of rows/columns in the matrix minus one. Matrices in Pine can have dynamic numbers of rows and columns that vary across bars. The total number of elements within a matrix is the product of the number of rows and columns (e.g., a 5x5 matrix has a total of 25). Like arrays, the total number of elements in a matrix cannot exceed 100,000.
Declaring a matrix
Pine Script™ uses the following syntax for matrix declaration:
[var/varip ][matrix<type> ]<identifier> = <expression>
Where <type> is a type template for the matrix that declares the type
of values it will contain, and the <expression> returns either a matrix instance of the type or na.
When declaring a matrix variable as na, users must specify that the identifier will reference matrices of a
specific type by including the matrix keyword
followed by a type template.
This line declares a new myMatrix variable with a value of na. It explicitly declares the variable as
matrix<float>, which tells the compiler that the variable can only accept
matrix objects containing
float values:
matrix<float> myMatrix = na
When a matrix variable is not assigned to na, the matrix
keyword and its type template are optional, as the compiler will use the type information from the object the variable references.
Here, we declare a myMatrix variable referencing a new matrix<float> instance with two rows, two columns,
and an initial_value of 0. The variable gets its type information from the new object in this case, so it
doesn’t require an explicit type declaration:
myMatrix = matrix.new<float>(2, 2, 0.0)
Using `var` and `varip` keywords
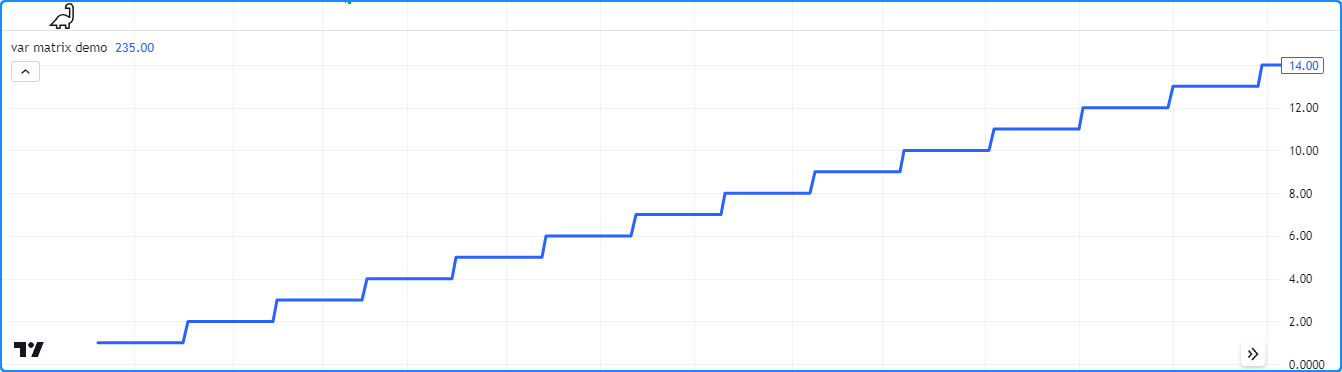
As with other variables, users can include the var or varip keywords to instruct a script to declare a matrix variable only once rather than on every bar. A matrix variable declared with this keyword will point to the same instance throughout the span of the chart unless the script explicitly assigns another matrix to it, allowing a matrix and its element references to persist between script iterations.
This script declares an m variable assigned to a matrix that holds a single row of two
int
elements using the var
keyword. On every 20th bar, the script adds 1 to the first element on the first row of the m matrix.
The plot() call displays this element
on the chart. As we see from the plot, the value of
m.get(0, 0) persists between bars, never
returning to the initial value of 0:
//@version=5
indicator("var matrix demo")

//@variable A 1x2 rectangular matrix declared only at `bar_index == 0`, i.e., the first bar.
var m = matrix.new<int>(1, 2, 0)

//@variable Is `true` on every 20th bar.
bool update = bar_index % 20 == 0

if update
    int currentValue = m.get(0, 0) // Get the current value of the first row and column.
    m.set(0, 0, currentValue + 1)  // Set the first row and column element value to `currentValue + 1`.

plot(m.get(0, 0), linewidth = 3) // Plot the value from the first row and column.
Note
Matrix variables declared using varip behave as ones using var on historical data, but they update their values for realtime bars (i.e., the bars since the script’s last compilation) on each new price tick. Matrices assigned to varip variables can only hold int, float, bool, color, or string types or user-defined types that exclusively contain within their fields these types or collections (arrays, matrices, or maps) of these types.
Reading and writing matrix elements
`matrix.get()` and `matrix.set()`
To retrieve the value from a matrix at a specified row and column index, use
matrix.get().
This function locates the specified matrix element and returns its value. Similarly, to
overwrite a specific element’s value, use
matrix.set()
to assign the element at the specified row and column to a new value.
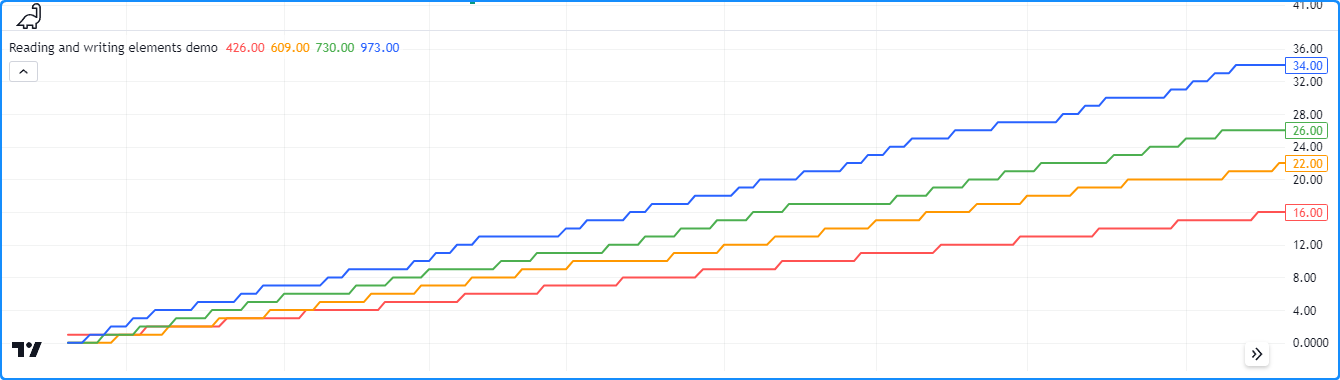
The example below defines a square matrix m with two rows and columns and an initial_value
of 0 for all elements on the first bar. The script adds 1 to each element’s value on different
bars using the m.get()
and m.set() methods.
It updates the first row’s first value once every 11 bars, the first row’s second value once every
seven bars, the second row’s first value once every five bars, and the second row’s second value
once every three bars. The script plots each element’s value on the chart:
//@version=5
indicator("Reading and writing elements demo")

//@variable A 2x2 square matrix of `float` values.
var m = matrix.new<float>(2, 2, 0.0)

switch
    bar_index % 11 == 0 => m.set(0, 0, m.get(0, 0) + 1.0) // Adds 1 to the value at row 0, column 0 every 11th bar.
    bar_index % 7  == 0 => m.set(0, 1, m.get(0, 1) + 1.0) // Adds 1 to the value at row 0, column 1 every 7th bar.
    bar_index % 5  == 0 => m.set(1, 0, m.get(1, 0) + 1.0) // Adds 1 to the value at row 1, column 0 every 5th bar.
    bar_index % 3  == 0 => m.set(1, 1, m.get(1, 1) + 1.0) // Adds 1 to the value at row 1, column 1 every 3rd bar.

plot(m.get(0, 0), "Row 0, Column 0 Value", color.red, 2)
plot(m.get(0, 1), "Row 0, Column 1 Value", color.orange, 2)
plot(m.get(1, 0), "Row 1, Column 0 Value", color.green, 2)
plot(m.get(1, 1), "Row 1, Column 1 Value", color.blue, 2)
`matrix.fill()`
To overwrite all matrix elements with a specific value, use
matrix.fill().
This function points all items in the entire matrix or within the from_row/column and
to_row/column index range to the value specified in the call. For example, this
snippet declares a 4x4 square matrix, then fills its elements with a
random value:
myMatrix = matrix.new<float>(4, 4)
myMatrix.fill(math.random())
Note when using matrix.fill() with matrices containing special types (line, linefill, box, polyline, label, table, or chart.point) or UDTs, all replaced elements will point to the same object passed in the function call.
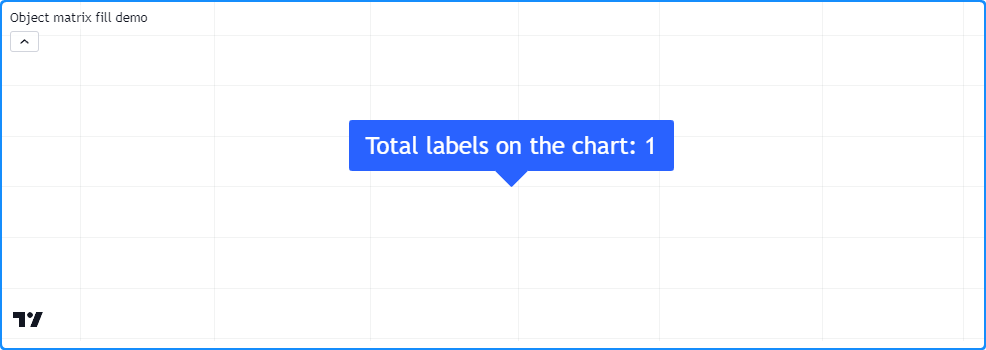
This script declares a matrix with four rows and columns of label
references, which it fills with a new label object on the first bar.
On each bar, the script sets the x attribute of the label referenced at row 0, column 0 to
bar_index, and the text attribute of the one referenced
at row 3, column 3 to the number of labels on the chart. Although the matrix can reference 16 (4x4) labels, each element points to the
same instance, resulting in only one label on the chart that updates its x and text attributes on each bar:
//@version=5
indicator("Object matrix fill demo")

//@variable A 4x4 label matrix.
var matrix<label> m = matrix.new<label>(4, 4)

// Fill `m` with a new label object on the first bar.
if bar_index == 0
    m.fill(label.new(0, 0, textcolor = color.white, size = size.huge))

//@variable The number of label objects on the chart.
int numLabels = label.all.size()

// Set the `x` of the label from the first row and column to `bar_index`.
m.get(0, 0).set_x(bar_index)
// Set the `text` of the label at the last row and column to the number of labels.
m.get(3, 3).set_text(str.format("Total labels on the chart: {0}", numLabels))
Rows and columns
Retrieving
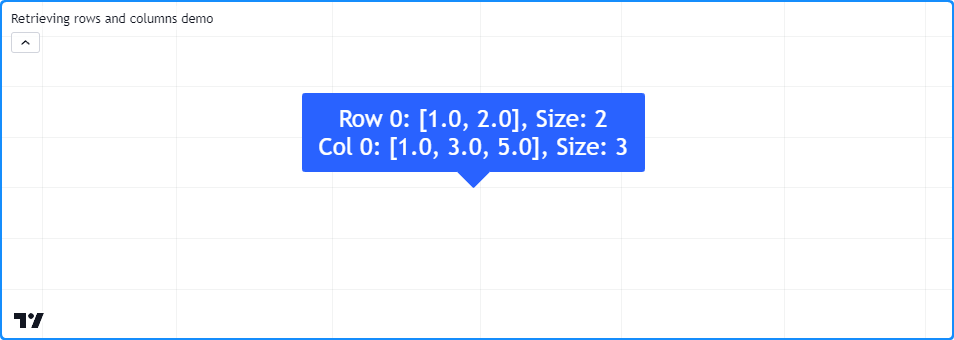
Matrices facilitate the retrieval of all values from a specific row or column via the matrix.row() and matrix.col() functions. These functions return the values as an array object sized according to the other dimension of the matrix, i.e., the size of a matrix.row() array equals the number of columns and the size of a matrix.col() array equals the number of rows.
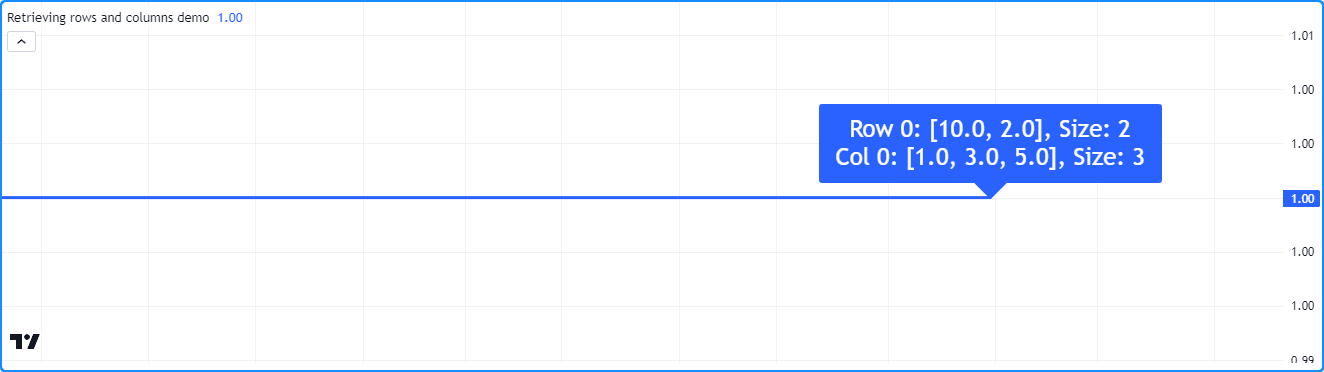
The script below populates a 3x2 m matrix with the values 1 - 6 on the first chart bar. It calls
the m.row() and
m.col() methods to access
the first row and column arrays from the matrix and displays them on the chart in a label along with the array sizes:
//@version=5
indicator("Retrieving rows and columns demo")

//@variable A 3x2 rectangular matrix.
var matrix<float> m = matrix.new<float>(3, 2)

if bar_index == 0
    m.set(0, 0, 1.0) // Set row 0, column 0 value to 1.
    m.set(0, 1, 2.0) // Set row 0, column 1 value to 2.
    m.set(1, 0, 3.0) // Set row 1, column 0 value to 3.
    m.set(1, 1, 4.0) // Set row 1, column 1 value to 4.
    m.set(2, 0, 5.0) // Set row 1, column 0 value to 5.
    m.set(2, 1, 6.0) // Set row 1, column 1 value to 6.

//@variable The first row of the matrix.
array<float> row0 = m.row(0)
//@variable The first column of the matrix.
array<float> column0 = m.col(0)

//@variable Displays the first row and column of the matrix and their sizes in a label.
var label debugLabel = label.new(0, 0, color = color.blue, textcolor = color.white, size = size.huge)
debugLabel.set_x(bar_index)
debugLabel.set_text(str.format("Row 0: {0}, Size: {1}\nCol 0: {2}, Size: {3}", row0, m.columns(), column0, m.rows()))
- Note that:
- To get the sizes of the arrays displayed in the label, we used the
rows()
and columns() methods
rather than array.size()
to demonstrate that the size of the
row0array equals the number of columns and the size of thecolumn0array equals the number of rows.
- To get the sizes of the arrays displayed in the label, we used the
rows()
and columns() methods
rather than array.size()
to demonstrate that the size of the
matrix.row() and matrix.col() copy the references in a row/column to a new array. Modifications to the arrays returned by these functions do not directly affect the elements or the shape of a matrix.
Here, we’ve modified the previous script to set the first element of row0 to 10 via the
array.set() method before displaying the label.
This script also plots the value from row 0, column 0. As we see, the label shows that the first element of the row0
array is 10. However, the plot shows that the
corresponding matrix element still has a value of 1:
//@version=5
indicator("Retrieving rows and columns demo")

//@variable A 3x2 rectangular matrix.
var matrix<float> m = matrix.new<float>(3, 2)

if bar_index == 0
    m.set(0, 0, 1.0) // Set row 0, column 0 value to 1.
    m.set(0, 1, 2.0) // Set row 0, column 1 value to 2.
    m.set(1, 0, 3.0) // Set row 1, column 0 value to 3.
    m.set(1, 1, 4.0) // Set row 1, column 1 value to 4.
    m.set(2, 0, 5.0) // Set row 1, column 0 value to 5.
    m.set(2, 1, 6.0) // Set row 1, column 1 value to 6.

//@variable The first row of the matrix.
array<float> row0 = m.row(0)
//@variable The first column of the matrix.
array<float> column0 = m.col(0)

// Set the first `row` element to 10.
row0.set(0, 10)

//@variable Displays the first row and column of the matrix and their sizes in a label.
var label debugLabel = label.new(0, m.get(0, 0), color = color.blue, textcolor = color.white, size = size.huge)
debugLabel.set_x(bar_index)
debugLabel.set_text(str.format("Row 0: {0}, Size: {1}\nCol 0: {2}, Size: {3}", row0, m.columns(), column0, m.rows()))

// Plot the first element of `m`.
plot(m.get(0, 0), linewidth = 3)
Although changes to an array returned by matrix.row() or matrix.col() do not directly affect a parent matrix, it’s important to note the resulting array from a matrix containing UDTs or special types, including line, linefill, box, polyline, label, table, or chart.point, behaves as a shallow copy of a row/column, i.e., the elements within an array returned from these functions point to the same objects as the corresponding matrix elements.
This script contains a custom myUDT type containing a value field with an initial value of 0. It declares
a 1x1 m matrix to hold a single myUDT instance on the first bar, then calls m.row(0) to copy the first
row of the matrix as an array. On every chart bar,
the script adds 1 to the value field of the first row array element. In this case, the value field of the
matrix element increases on every bar as well since both elements reference the same object:
//@version=5
indicator("Row with reference types demo")

//@type A custom type that holds a float value.
type myUDT
    float value = 0.0

//@variable A 1x1 matrix of `myUDT` type.
var matrix<myUDT> m = matrix.new<myUDT>(1, 1, myUDT.new())
//@variable A shallow copy of the first row of `m`.
array<myUDT> row = m.row(0)
//@variable The first element of the `row`.
myUDT firstElement = row.get(0)

firstElement.value += 1.0 // Add 1 to the `value` field of `firstElement`. Also affects the element in the matrix.

plot(m.get(0, 0).value, linewidth = 3) // Plot the `value` of the `myUDT` object from the first row and column of `m`.
Inserting
Scripts can add new rows and columns to a matrix via
matrix.add_row()
and matrix.add_col().
These functions insert the value references from an array
into a matrix at the specified row/column index. If the id matrix is empty (has no rows or columns), the array_id
in the call can be of any size. If a row/column exists at the specified index, the matrix increases the index value for the
existing row/column and all after it by 1.
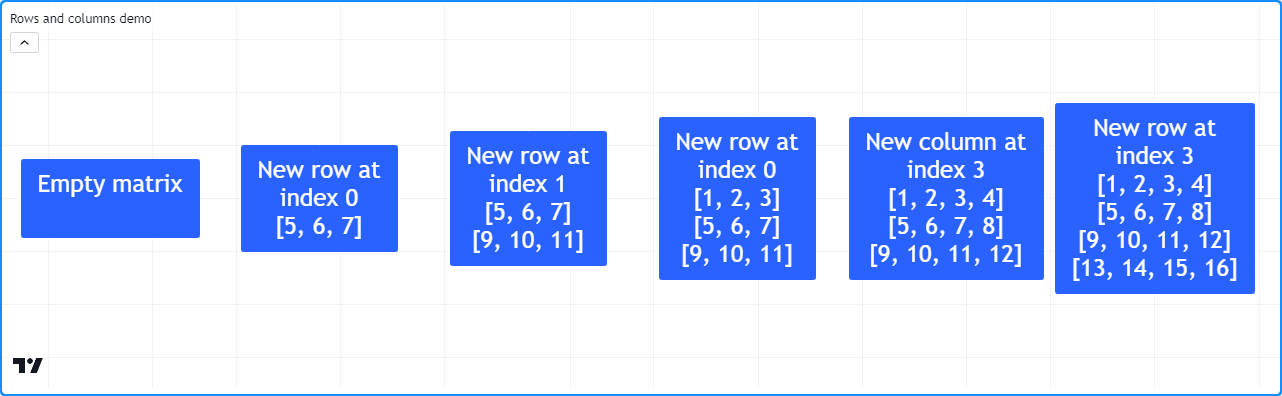
The script below declares an empty m matrix and inserts rows and columns using the
m.add_row() and
m.add_col() methods.
It first inserts an array with three elements at row 0, turning m into a 1x3 matrix, then another
at row 1, changing the shape to 2x3. After that, the script inserts another array at row 0, which changes
the shape of m to 3x3 and shifts the index of all rows previously at index 0 and higher. It inserts
another array at the last column index, changing the shape to 3x4. Finally, it adds an array with four
values at the end row index.
The resulting matrix has four rows and columns and contains values 1-16 in ascending order. The script
displays the rows of m after each row/column insertion with a user-defined debugLabel() function to visualize the process:
//@version=5
indicator("Rows and columns demo")

//@function Displays the rows of a matrix in a label with a note.
//@param    this The matrix to display.
//@param    barIndex The `bar_index` to display the label at.
//@param    bgColor The background color of the label.
//@param    textColor The color of the label's text.
//@param    note The text to display above the rows.
method debugLabel(
     matrix<float> this, int barIndex = bar_index, color bgColor = color.blue,
     color textColor = color.white, string note = ""
 ) =>
    labelText = note + "\n" + str.tostring(this)
    if barstate.ishistory
        label.new(
             barIndex, 0, labelText, color = bgColor, style = label.style_label_center,
             textcolor = textColor, size = size.huge
         )

//Create an empty matrix.
var m = matrix.new<float>()

if bar_index == last_bar_index - 1
    debugLabel(m, bar_index - 30, note = "Empty matrix")

    // Insert an array at row 0. `m` will now have 1 row and 3 columns.
    m.add_row(0, array.from(5, 6, 7))
    debugLabel(m, bar_index - 20, note = "New row at\nindex 0")

    // Insert an array at row 1. `m` will now have 2 rows and 3 columns.
    m.add_row(1, array.from(9, 10, 11))
    debugLabel(m, bar_index - 10, note = "New row at\nindex 1")

    // Insert another array at row 0. `m` will now have 3 rows and 3 columns.
    // The values previously on row 0 will now be on row 1, and the values from row 1 will be on row 2.
    m.add_row(0, array.from(1, 2, 3))
    debugLabel(m, bar_index, note = "New row at\nindex 0")

    // Insert an array at column 3. `m` will now have 3 rows and 4 columns.
    m.add_col(3, array.from(4, 8, 12))
    debugLabel(m, bar_index + 10, note = "New column at\nindex 3")

    // Insert an array at row 3. `m` will now have 4 rows and 4 columns.
    m.add_row(3, array.from(13, 14, 15, 16))
    debugLabel(m, bar_index + 20, note = "New row at\nindex 3")
Note
Just as the row or column arrays retrieved from a matrix of line, linefill, box, polyline, label, table, chart.point, or UDT instances behave as shallow copies, the elements of matrices containing such types reference the same objects as the arrays inserted into them. Modifications to the element values in either object affect the other in such cases.
Removing
To remove a specific row or column from a matrix, use matrix.remove_row() and matrix.remove_col(). These functions remove the specified row/column and decrease the index values of all rows/columns after it by 1.
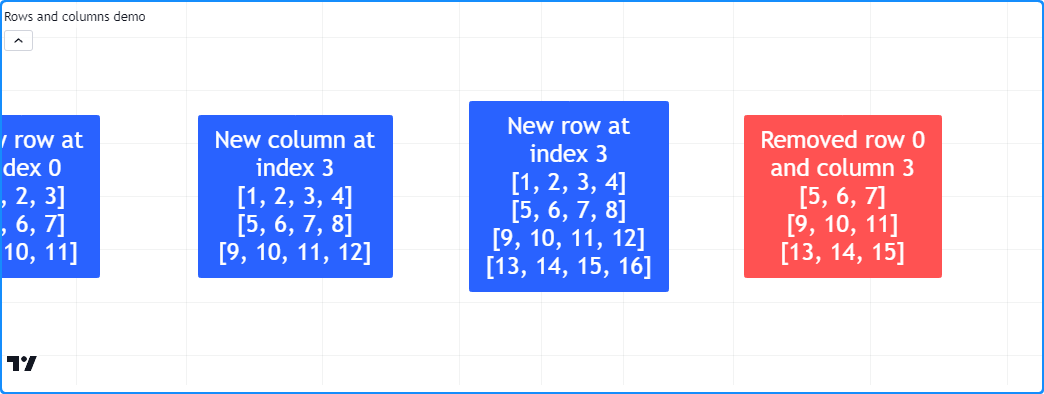
For this example, we’ve added these lines of code to our “Rows and columns demo” script from the section above:
// Removing example

    // Remove the first row and last column from the matrix. `m` will now have 3 rows and 3 columns.
    m.remove_row(0)
    m.remove_col(3)
    debugLabel(m, bar_index + 30, color.red, note = "Removed row 0\nand column 3")
This code removes the first row and the last column of the m matrix using the
m.remove_row() and
m.remove_col() methods
and displays the rows in a label at bar_index + 30. As we can see, m has a 3x3 shape after executing
this block, and the index values for all existing rows are reduced by 1:
Swapping
To swap the rows and columns of a matrix without altering its dimensions, use
matrix.swap_rows()
and matrix.swap_columns().
These functions swap the locations of the elements at the row1/column1 and row2/column2 indices.
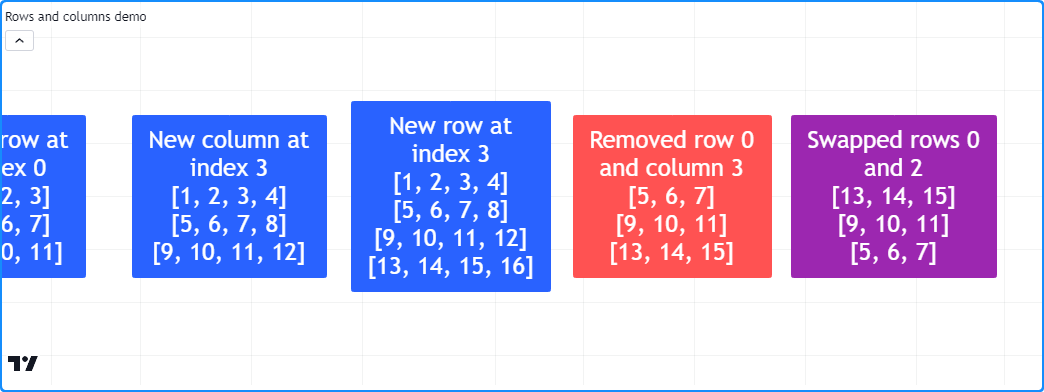
Let’s add the following lines to the previous example, which swap
the first and last rows of m and display the changes in a label at bar_index + 40:
// Swapping example

    // Swap the first and last row. `m` retains the same dimensions.
    m.swap_rows(0, 2)
    debugLabel(m, bar_index + 40, color.purple, note = "Swapped rows 0\nand 2")
In the new label, we see the matrix has the same number of rows as before, and the first and last rows have traded places:
Replacing
It may be desirable in some cases to completely replace a row or column in a matrix. To do so,
insert the new array at the desired row/column
and remove the old elements previously at that index.
In the following code, we’ve defined a replaceRow() method that uses the
add_row() method to
insert the new values at the row index and uses the
remove_row() method to
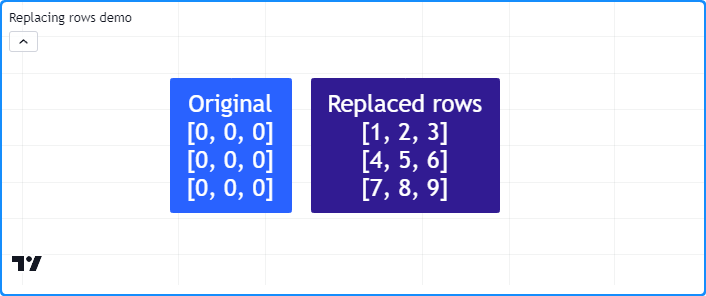
remove the old row that moved to the row + 1 index. This script uses the replaceRow() method to fill
the rows of a 3x3 matrix with the numbers 1-9. It draws a label on the chart before and after replacing the
rows using the custom debugLabel() method:
//@version=5
indicator("Replacing rows demo")

//@function Displays the rows of a matrix in a label with a note.
//@param    this The matrix to display.
//@param    barIndex The `bar_index` to display the label at.
//@param    bgColor The background color of the label.
//@param    textColor The color of the label's text.
//@param    note The text to display above the rows.
method debugLabel(
     matrix<float> this, int barIndex = bar_index, color bgColor = color.blue,
     color textColor = color.white, string note = ""
 ) =>
    labelText = note + "\n" + str.tostring(this)
    if barstate.ishistory
        label.new(
             barIndex, 0, labelText, color = bgColor, style = label.style_label_center,
             textcolor = textColor, size = size.huge
         )

//@function Replaces the `row` of `this` matrix with a new array of `values`.
//@param    row The row index to replace.
//@param    values The array of values to insert.
method replaceRow(matrix<float> this, int row, array<float> values) =>
    this.add_row(row, values) // Inserts a copy of the `values` array at the `row`.
    this.remove_row(row + 1)  // Removes the old elements previously at the `row`.

//@variable A 3x3 matrix.
var matrix<float> m = matrix.new<float>(3, 3, 0.0)

if bar_index == last_bar_index - 1
    m.debugLabel(note = "Original")
    // Replace each row of `m`.
    m.replaceRow(0, array.from(1.0, 2.0, 3.0))
    m.replaceRow(1, array.from(4.0, 5.0, 6.0))
    m.replaceRow(2, array.from(7.0, 8.0, 9.0))
    m.debugLabel(bar_index + 10, note = "Replaced rows")
Looping through a matrix
`for`
When a script only needs to iterate over the row/column indices in a matrix, the most common method is to use
for loops. For example, this line creates a
loop with a row value that starts at 0 and increases by one until it reaches one less than the number of rows
in the m matrix (i.e., the last row index):
for row = 0 to m.rows() - 1
To iterate over all index values in the m matrix, we can create a nested loop that iterates over each column index on each row value:
for row = 0 to m.rows() - 1
    for column = 0 to m.columns() - 1
Let’s use this nested structure to create a method that visualizes matrix elements.
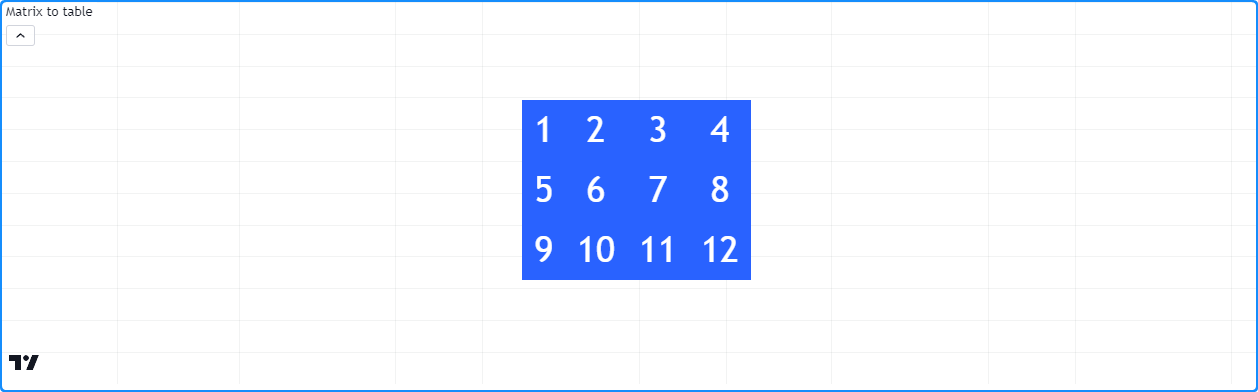
In the script below, we’ve defined a toTable() method that displays the elements of a matrix within a
table object. It iterates over each
row index and over each column index on every row. Within the loop, it converts each element
to a string to display in the corresponding table cell.
On the first bar, the script creates an empty m matrix, populates it with rows, and calls m.toTable() to display its elements:
//@version=5
indicator("for loop demo", "Matrix to table")

//@function Displays the elements of `this` matrix in a table.
//@param    this The matrix to display.
//@param    position The position of the table on the chart.
//@param    bgColor The background color of the table.
//@param    textColor The color of the text in each cell.
//@param    note A note string to display on the bottom row of the table.
//@returns  A new `table` object with cells corresponding to each element of `this` matrix.
method toTable(
     matrix<float> this, string position = position.middle_center,
     color bgColor = color.blue, color textColor = color.white,
     string note = na
 ) =>
    //@variable The number of rows in `this` matrix.
    int rows = this.rows()
    //@variable The number of columns in `this` matrix.
    int columns = this.columns()
    //@variable A table that displays the elements of `this` matrix with an optional `note` cell.
    table result = table.new(position, columns, rows + 1, bgColor)

    // Iterate over each row index of `this` matrix.
    for row = 0 to rows - 1
        // Iterate over each column index of `this` matrix on each `row`.
        for col = 0 to columns - 1
            //@variable The element from `this` matrix at the `row` and `col` index.
            float element = this.get(row, col)
            // Initialize the corresponding `result` cell with the `element` value.
            result.cell(col, row, str.tostring(element), text_color = textColor, text_size = size.huge)

    // Initialize a merged cell on the bottom row if a `note` is provided.
    if not na(note)
        result.cell(0, rows, note, text_color = textColor, text_size = size.huge)
        result.merge_cells(0, rows, columns - 1, rows)

    result // Return the `result` table.

//@variable A 3x4 matrix of values.
var m = matrix.new<float>()

if bar_index == 0
    // Add rows to `m`.
    m.add_row(0, array.from(1, 2, 3))
    m.add_row(1, array.from(5, 6, 7))
    m.add_row(2, array.from(9, 10, 11))
    // Add a column to `m`.
    m.add_col(3, array.from(4, 8, 12))
    // Display the elements of `m` in a table.
    m.toTable()
`for…in`
When a script needs to iterate over and retrieve the rows of a matrix, using the
for…in
structure is often preferred over the standard for loop. This structure directly references
the row arrays in a matrix, making it a more convenient option for such use cases.
For example, this line creates a loop that returns a row array for each row
in the m matrix:
for row in m
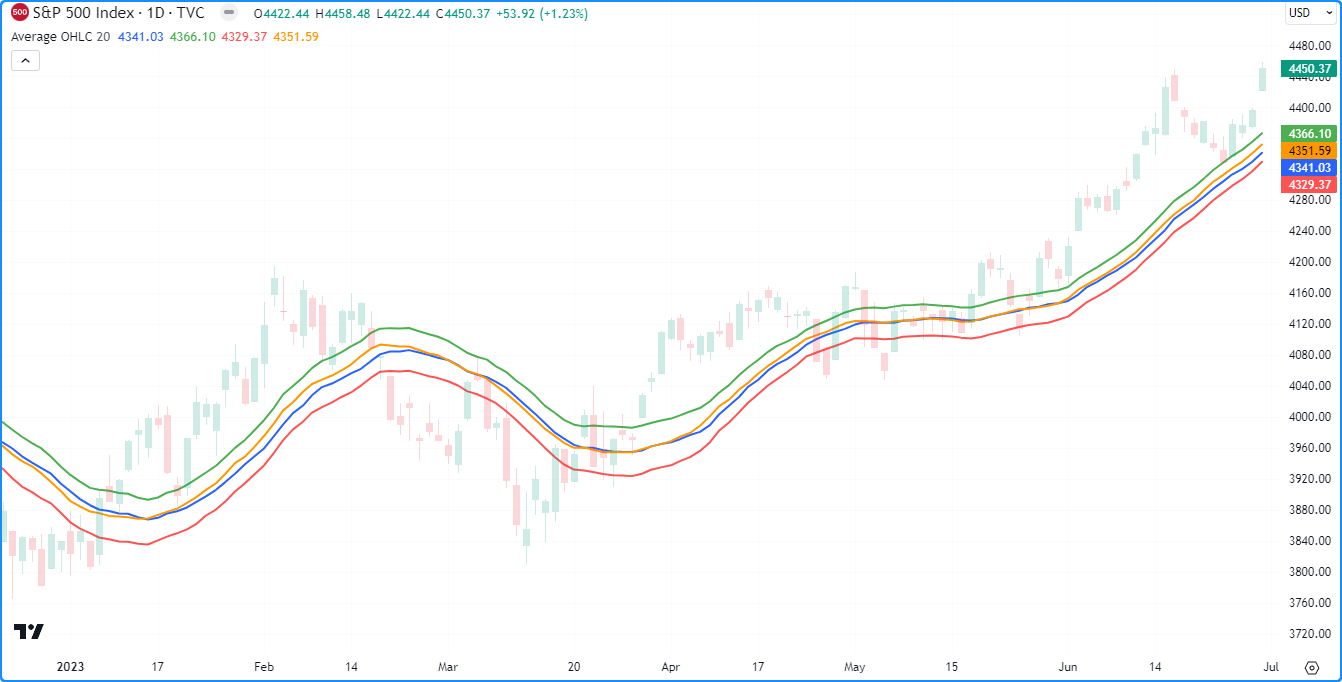
The following indicator calculates the moving average of OHLC data with an input length and displays the values on the chart.
The custom rowWiseAvg() method loops through the rows of a matrix using a for...in structure to produce an array containing
the array.avg() of each row.
On the first chart bar, the script creates a new m matrix with four rows and length columns, which it queues a new column of
OHLC data into via the m.add_col() and
m.remove_col() methods on each subsequent bar.
It uses m.rowWiseAvg() to calculate the array of row-wise averages, then it plots the element values on the chart:
//@version=5
indicator("for...in loop demo", "Average OHLC", overlay = true)

//@variable The number of terms in the average.
int length = input.int(20, "Length", minval = 1)

//@function Calculates the average of each matrix row.
method rowWiseAvg(matrix<float> this) =>
    //@variable An array with elements corresponding to each row's average.
    array<float> result = array.new<float>()
    // Iterate over each `row` of `this` matrix.
    for row in this
        // Push the average of each `row` into the `result`.
        result.push(row.avg())
    result // Return the resulting array.

//@variable A 4x`length` matrix of values.
var matrix<float> m = matrix.new<float>(4, length)

// Add a new column containing OHLC values to the matrix.
m.add_col(m.columns(), array.from(open, high, low, close))
// Remove the first column.
m.remove_col(0)

//@variable An array containing averages of `open`, `high`, `low`, and `close` over `length` bars.
array<float> averages = m.rowWiseAvg()

plot(averages.get(0), "Average Open",  color.blue,   2)
plot(averages.get(1), "Average High",  color.green,  2)
plot(averages.get(2), "Average Low",   color.red,    2)
plot(averages.get(3), "Average Close", color.orange, 2)
- Note that:
for...inloops can also reference the index value of each row. For example,for [i, row] in mcreates a tuple containing theirow index and the correspondingrowarray from themmatrix on each loop iteration.
Copying a matrix
Shallow copies
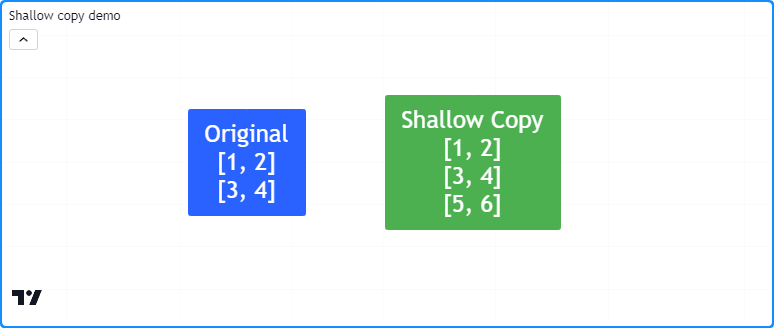
Pine scripts can copy matrices via matrix.copy(). This function returns a shallow copy of a matrix that does not affect the shape of the original matrix or its references.
For example, this script assigns a new matrix to the myMatrix variable and adds two columns. It creates a new myCopy
matrix from myMatrix using the myMatrix.copy()
method, then adds a new row. It displays the rows of both matrices in labels via the user-defined debugLabel() function:
//@version=5
indicator("Shallow copy demo")

//@function Displays the rows of a matrix in a label with a note.
//@param    this The matrix to display.
//@param    barIndex The `bar_index` to display the label at.
//@param    bgColor The background color of the label.
//@param    textColor The color of the label's text.
//@param    note The text to display above the rows.
method debugLabel(
     matrix<float> this, int barIndex = bar_index, color bgColor = color.blue,
     color textColor = color.white, string note = ""
 ) =>
    labelText = note + "\n" + str.tostring(this)
    if barstate.ishistory
        label.new(
             barIndex, 0, labelText, color = bgColor, style = label.style_label_center,
             textcolor = textColor, size = size.huge
         )

//@variable A 2x2 `float` matrix.
matrix<float> myMatrix = matrix.new<float>()
myMatrix.add_col(0, array.from(1.0, 3.0))
myMatrix.add_col(1, array.from(2.0, 4.0))

//@variable A shallow copy of `myMatrix`.
matrix<float> myCopy = myMatrix.copy()
// Add a row to the last index of `myCopy`.
myCopy.add_row(myCopy.rows(), array.from(5.0, 6.0))

if bar_index == last_bar_index - 1
    // Display the rows of both matrices in separate labels.
    myMatrix.debugLabel(note = "Original")
    myCopy.debugLabel(bar_index + 10, color.green, note = "Shallow Copy")
It’s important to note that the elements within shallow copies of a matrix point to the same values as the original matrix. When matrices contain special types (line, linefill, box, polyline, label, table, or chart.point) or user-defined types, the elements of a shallow copy reference the same objects as the original.
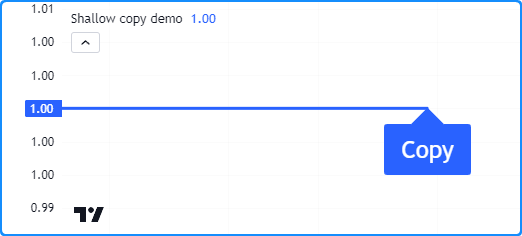
This script declares a myMatrix variable with a newLabel as the initial value. It then copies
myMatrix to a myCopy variable via myMatrix.copy()
and plots the number of labels. As we see below, there’s only one label
on the chart, as the element in myCopy references the same object as the element in myMatrix.
Consequently, changes to the element values in myCopy affect the values in both matrices:
//@version=5
indicator("Shallow copy demo")

//@variable Initial value of the original matrix elements.
var label newLabel = label.new(
     bar_index, 1, "Original", color = color.blue, textcolor = color.white, size = size.huge
 )

//@variable A 1x1 matrix containing a new `label` instance.
var matrix<label> myMatrix = matrix.new<label>(1, 1, newLabel)
//@variable A shallow copy of `myMatrix`.
var matrix<label> myCopy = myMatrix.copy()

//@variable The first label from the `myCopy` matrix.
label testLabel = myCopy.get(0, 0)

// Change the `text`, `style`, and `x` values of `testLabel`. Also affects the `newLabel`.
testLabel.set_text("Copy")
testLabel.set_style(label.style_label_up)
testLabel.set_x(bar_index)

// Plot the total number of labels.
plot(label.all.size(), linewidth = 3)
Deep copies
One can produce a deep copy of a matrix (i.e., a matrix whose elements point to copies of the original values) by explicitly copying each object the matrix references.
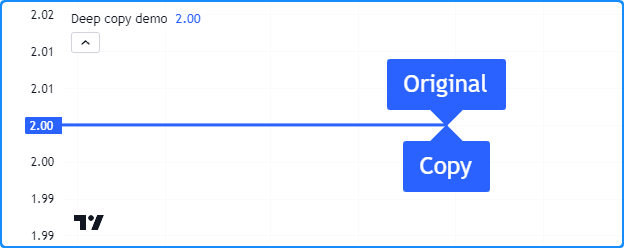
Here, we’ve added a deepCopy() user-defined method to our previous script. The method creates a new matrix
and uses nested for loops to assign all elements to copies of the
originals. When the script calls this method instead of the built-in
copy(), we see that there are now two
labels on the chart, and any changes to the label from myCopy do not affect the one from myMatrix:
//@version=5
indicator("Deep copy demo")

//@function Returns a deep copy of a label matrix.
method deepCopy(matrix<label> this) =>
    //@variable A deep copy of `this` matrix.
    matrix<label> that = this.copy()
    for row = 0 to that.rows() - 1
        for column = 0 to that.columns() - 1
            // Assign the element at each `row` and `column` of `that` matrix to a copy of the retrieved label.
            that.set(row, column, that.get(row, column).copy())
    that

//@variable Initial value of the original matrix.
var label newLabel = label.new(
     bar_index, 2, "Original", color = color.blue, textcolor = color.white, size = size.huge
 )

//@variable A 1x1 matrix containing a new `label` instance.
var matrix<label> myMatrix = matrix.new<label>(1, 1, newLabel)
//@variable A deep copy of `myMatrix`.
var matrix<label> myCopy = myMatrix.deepCopy()

//@variable The first label from the `myCopy` matrix.
label testLabel = myCopy.get(0, 0)

// Change the `text`, `style`, and `x` values of `testLabel`. Does not affect the `newLabel`.
testLabel.set_text("Copy")
testLabel.set_style(label.style_label_up)
testLabel.set_x(bar_index)

// Change the `x` value of `newLabel`.
newLabel.set_x(bar_index)

// Plot the total number of labels.
plot(label.all.size(), linewidth = 3)
Submatrices
In Pine, a submatrix is a shallow copy of an existing matrix
that only includes the rows and columns specified by the from_row/column and to_row/column parameters.
In essence, it is a sliced copy of a matrix.
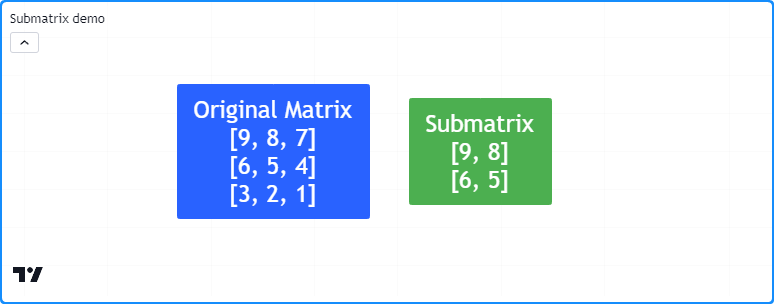
For example, the script below creates an mSub matrix from the m matrix via the
m.submatrix() method, then calls
our user-defined debugLabel() function to display the rows of both matrices in labels:
//@version=5
indicator("Submatrix demo")

//@function Displays the rows of a matrix in a label with a note.
//@param    this The matrix to display.
//@param    barIndex The `bar_index` to display the label at.
//@param    bgColor The background color of the label.
//@param    textColor The color of the label's text.
//@param    note The text to display above the rows.
method debugLabel(
     matrix<float> this, int barIndex = bar_index, color bgColor = color.blue,
     color textColor = color.white, string note = ""
 ) =>
    labelText = note + "\n" + str.tostring(this)
    if barstate.ishistory
        label.new(
             barIndex, 0, labelText, color = bgColor, style = label.style_label_center,
             textcolor = textColor, size = size.huge
         )

//@variable A 3x3 matrix of values.
var m = matrix.new<float>()

if bar_index == last_bar_index - 1
    // Add columns to `m`.
    m.add_col(0, array.from(9, 6, 3))
    m.add_col(1, array.from(8, 5, 2))
    m.add_col(2, array.from(7, 4, 1))
    // Display the rows of `m`.
    m.debugLabel(note = "Original Matrix")

    //@variable A 2x2 submatrix of `m` containing the first two rows and columns.
    matrix<float> mSub = m.submatrix(from_row = 0, to_row = 2, from_column = 0, to_column = 2)
    // Display the rows of `mSub`
    debugLabel(mSub, bar_index + 10, bgColor = color.green, note = "Submatrix")
Scope and history
Matrix variables leave historical trails on each bar, allowing scripts to use the history-referencing operator [] to interact with past matrix instances previously assigned to a variable. Additionally, scripts can modify matrices assigned to global variables from within the scopes of functions, methods, and conditional structures.
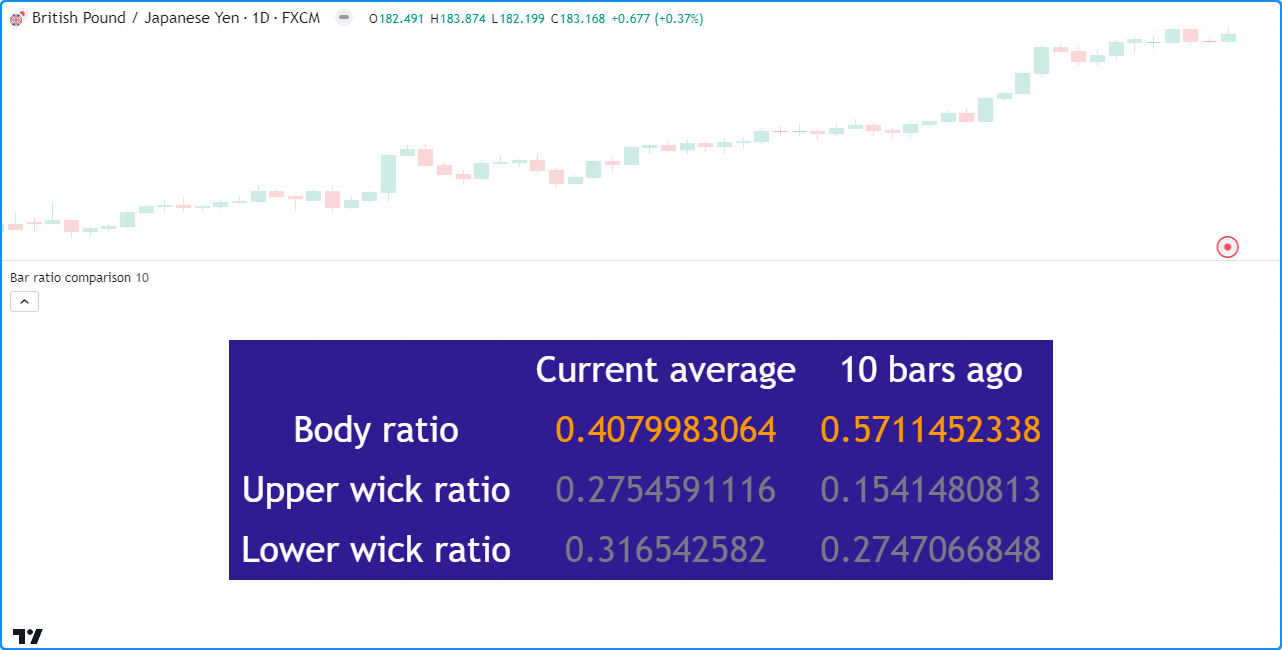
This script calculates the average ratios of body and wick distances relative to the bar range over length bars.
It displays the data along with values from length bars ago in a table. The user-defined addData() function
adds columns of current and historical ratios to the globalMatrix, and the calcAvg() function references previous
matrices assigned to globalMatrix using the []
operator to calculate a matrix of averages:
//@version=5
indicator("Scope and history demo", "Bar ratio comparison")

int length = input.int(10, "Length", 1)

//@variable A global matrix.
matrix<float> globalMatrix = matrix.new<float>()

//@function Calculates the ratio of body range to candle range.
bodyRatio() =>
    math.abs(close - open) / (high - low)

//@function Calculates the ratio of upper wick range to candle range.
upperWickRatio() =>
    (high - math.max(open, close)) / (high - low)

//@function Calculates the ratio of lower wick range to candle range.
lowerWickRatio() =>
    (math.min(open, close) - low) / (high - low)

//@function Adds data to the `globalMatrix`.
addData() =>
    // Add a new column of data at `column` 0.
    globalMatrix.add_col(0, array.from(bodyRatio(), upperWickRatio(), lowerWickRatio()))
    //@variable The column of `globalMatrix` from index 0 `length` bars ago.
    array<float> pastValues = globalMatrix.col(0)[length]
    // Add `pastValues` to the `globalMatrix`, or an array of `na` if `pastValues` is `na`.
    if na(pastValues)
        globalMatrix.add_col(1, array.new<float>(3))
    else
        globalMatrix.add_col(1, pastValues)

//@function Returns the `length`-bar average of matrices assigned to `globalMatrix` on historical bars.
calcAvg() =>
    //@variable The sum historical `globalMatrix` matrices.
    matrix<float> sums = matrix.new<float>(globalMatrix.rows(), globalMatrix.columns(), 0.0)
    for i = 0 to length - 1
        //@variable The `globalMatrix` matrix `i` bars before the current bar.
        matrix<float> previous = globalMatrix[i]
        // Break the loop if `previous` is `na`.
        if na(previous)
            sums.fill(na)
            break
        // Assign the sum of `sums` and `previous` to `sums`.
        sums := matrix.sum(sums, previous)
    // Divide the `sums` matrix by the `length`.
    result = sums.mult(1.0 / length)

// Add data to the `globalMatrix`.
addData()

//@variable The historical average of the `globalMatrix` matrices.
globalAvg = calcAvg()

//@variable A `table` displaying information from the `globalMatrix`.
var table infoTable = table.new(
     position.middle_center, globalMatrix.columns() + 1, globalMatrix.rows() + 1, bgcolor = color.navy
 )

// Define value cells.
for [i, row] in globalAvg
    for [j, value] in row
        color textColor = value > 0.333 ? color.orange : color.gray
        infoTable.cell(j + 1, i + 1, str.tostring(value), text_color = textColor, text_size = size.huge)

// Define header cells.
infoTable.cell(0, 1, "Body ratio", text_color = color.white, text_size = size.huge)
infoTable.cell(0, 2, "Upper wick ratio", text_color = color.white, text_size = size.huge)
infoTable.cell(0, 3, "Lower wick ratio", text_color = color.white, text_size = size.huge)
infoTable.cell(1, 0, "Current average", text_color = color.white, text_size = size.huge)
infoTable.cell(2, 0, str.format("{0} bars ago", length), text_color = color.white, text_size = size.huge)
- Note that:
- The
addData()andcalcAvg()functions have no parameters, as they directly interact with theglobalMatrixandlengthvariables declared in the outer scope. calcAvg()calculates the average by addingpreviousmatrices using matrix.sum() and multiplying all elements by1 / lengthusing matrix.mult(). We discuss these and other specialized functions in our Matrix calculations section below.
- The
Inspecting a matrix
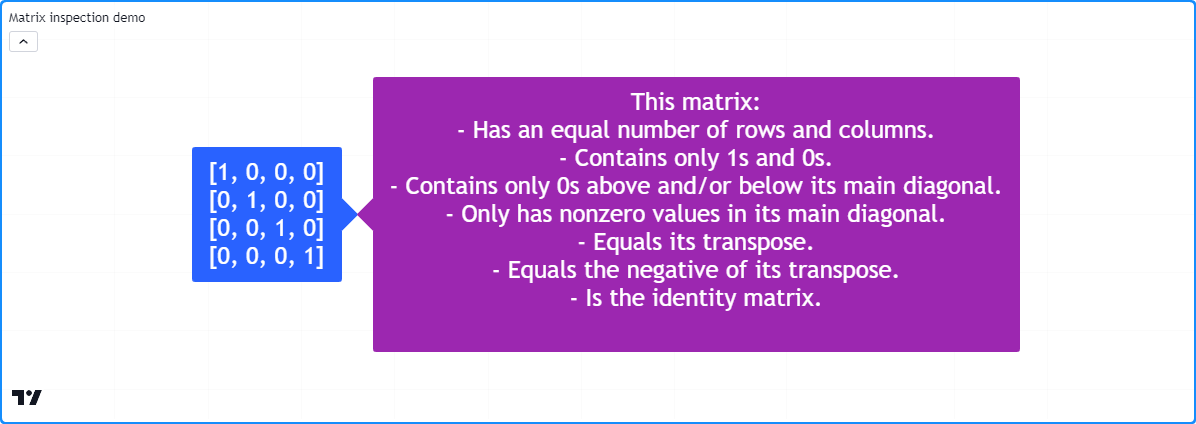
The ability to inspect the shape of a matrix and patterns within its elements is crucial, as it helps reveal important information about a matrix and its compatibility with various calculations and transformations. Pine Script™ includes several built-ins for matrix inspection, including matrix.is_square(), matrix.is_identity(), matrix.is_diagonal(), matrix.is_antidiagonal(), matrix.is_symmetric(), matrix.is_antisymmetric(), matrix.is_triangular(), matrix.is_stochastic(), matrix.is_binary(), and matrix.is_zero().
To demonstrate these features, this example contains a custom inspect() method that uses conditional blocks with
matrix.is_*() functions to return information about a matrix. It displays a string representation of an m
matrix and the description returned from m.inspect() in labels on the chart:
//@version=5
indicator("Matrix inspection demo")

//@function Inspects a matrix using `matrix.is_*()` functions and returns a `string` describing some of its features.
method inspect(matrix<int> this)=>
    //@variable A string describing `this` matrix.
    string result = "This matrix:\n"
    if this.is_square()
        result += "- Has an equal number of rows and columns.\n"
    if this.is_binary()
        result += "- Contains only 1s and 0s.\n"
    if this.is_zero()
        result += "- Is filled with 0s.\n"
    if this.is_triangular()
        result += "- Contains only 0s above and/or below its main diagonal.\n"
    if this.is_diagonal()
        result += "- Only has nonzero values in its main diagonal.\n"
    if this.is_antidiagonal()
        result += "- Only has nonzero values in its main antidiagonal.\n"
    if this.is_symmetric()
        result += "- Equals its transpose.\n"
    if this.is_antisymmetric()
        result += "- Equals the negative of its transpose.\n"
    if this.is_identity()
        result += "- Is the identity matrix.\n"
    result

//@variable A 4x4 identity matrix.
matrix<int> m = matrix.new<int>()

// Add rows to the matrix.
m.add_row(0, array.from(1, 0, 0, 0))
m.add_row(1, array.from(0, 1, 0, 0))
m.add_row(2, array.from(0, 0, 1, 0))
m.add_row(3, array.from(0, 0, 0, 1))

if bar_index == last_bar_index - 1
    // Display the `m` matrix in a blue label.
    label.new(
         bar_index, 0, str.tostring(m), color = color.blue, style = label.style_label_right,
         textcolor = color.white, size = size.huge
     )
    // Display the result of `m.inspect()` in a purple label.
    label.new(
         bar_index, 0, m.inspect(), color = color.purple, style = label.style_label_left,
         textcolor = color.white, size = size.huge
     )
Manipulating a matrix
Reshaping
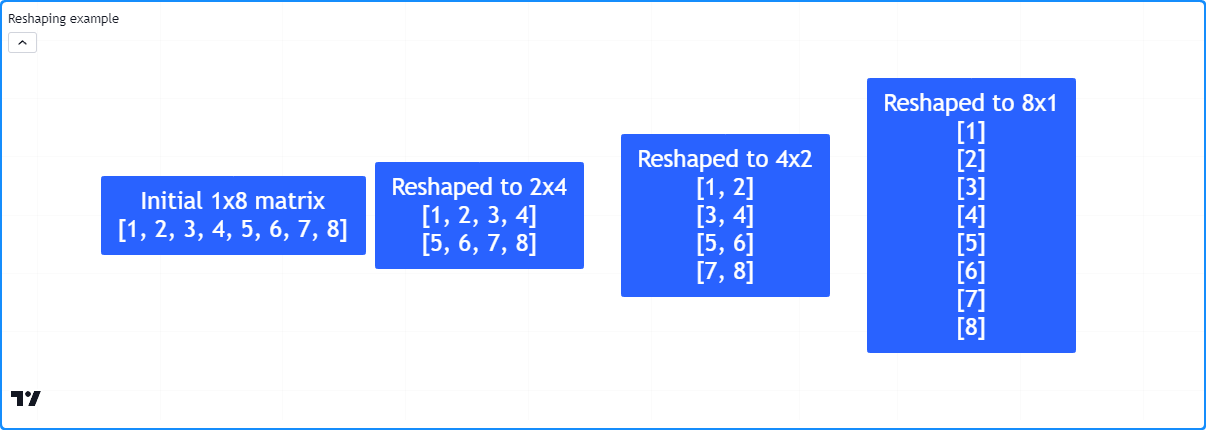
The shape of a matrix can determine its compatibility with various matrix operations. In some cases, it is necessary to change the dimensions of a matrix without affecting the number of elements or the values they reference, otherwise known as reshaping. To reshape a matrix in Pine, use the matrix.reshape() function.
This example demonstrates the results of multiple reshaping operations on a matrix. The initial m matrix has a 1x8 shape
(one row and eight columns). Through successive calls to the m.reshape()
method, the script changes the shape of m to 2x4, 4x2, and 8x1. It displays each reshaped matrix in a label on the chart
using the custom debugLabel() method:
//@version=5
indicator("Reshaping example")

//@function Displays the rows of a matrix in a label with a note.
//@param    this The matrix to display.
//@param    barIndex The `bar_index` to display the label at.
//@param    bgColor The background color of the label.
//@param    textColor The color of the label's text.
//@param    note The text to display above the rows.
method debugLabel(
     matrix<float> this, int barIndex = bar_index, color bgColor = color.blue,
     color textColor = color.white, string note = ""
 ) =>
    labelText = note + "\n" + str.tostring(this)
    if barstate.ishistory
        label.new(
             barIndex, 0, labelText, color = bgColor, style = label.style_label_center,
             textcolor = textColor, size = size.huge
         )

//@variable A matrix containing the values 1-8.
matrix<int> m = matrix.new<int>()

if bar_index == last_bar_index - 1
    // Add the initial vector of values.
    m.add_row(0, array.from(1, 2, 3, 4, 5, 6, 7, 8))
    m.debugLabel(note = "Initial 1x8 matrix")

    // Reshape. `m` now has 2 rows and 4 columns.
    m.reshape(2, 4)
    m.debugLabel(bar_index + 10, note = "Reshaped to 2x4")

    // Reshape. `m` now has 4 rows and 2 columns.
    m.reshape(4, 2)
    m.debugLabel(bar_index + 20, note = "Reshaped to 4x2")

    // Reshape. `m` now has 8 rows and 1 column.
    m.reshape(8, 1)
    m.debugLabel(bar_index + 30, note = "Reshaped to 8x1")
- Note that:
- The order of elements in
mdoes not change with eachm.reshape()call. - When reshaping a matrix, the product of the
rowsandcolumnsarguments must equal the matrix.elements_count() value, as matrix.reshape() cannot change the number of elements in a matrix.
- The order of elements in
Reversing
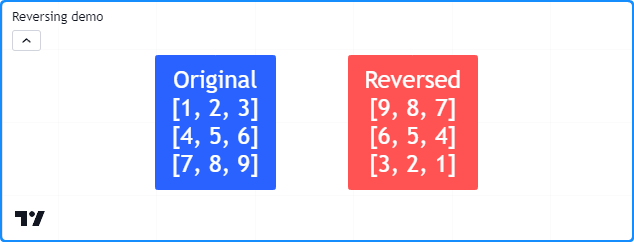
One can reverse the order of all elements in a matrix using
matrix.reverse().
This function moves the references of an m-by-n matrix id at the i-th row and j-th column to
the m - 1 - i row and n - 1 - j column.
For example, this script creates a 3x3 matrix containing the values 1-9 in ascending order, then
uses the reverse()
method to reverse its contents. It displays the original and modified versions of the matrix in
labels on the chart via m.debugLabel():
//@version=5
indicator("Reversing demo")

//@function Displays the rows of a matrix in a label with a note.
//@param    this The matrix to display.
//@param    barIndex The `bar_index` to display the label at.
//@param    bgColor The background color of the label.
//@param    textColor The color of the label's text.
//@param    note The text to display above the rows.
method debugLabel(
     matrix<float> this, int barIndex = bar_index, color bgColor = color.blue,
     color textColor = color.white, string note = ""
 ) =>
    labelText = note + "\n" + str.tostring(this)
    if barstate.ishistory
        label.new(
             barIndex, 0, labelText, color = bgColor, style = label.style_label_center,
             textcolor = textColor, size = size.huge
         )

//@variable A 3x3 matrix.
matrix<float> m = matrix.new<float>()

// Add rows to `m`.
m.add_row(0, array.from(1, 2, 3))
m.add_row(1, array.from(4, 5, 6))
m.add_row(2, array.from(7, 8, 9))

if bar_index == last_bar_index - 1
    // Display the contents of `m`.
    m.debugLabel(note = "Original")
    // Reverse `m`, then display its contents.
    m.reverse()
    m.debugLabel(bar_index + 10, color.red, note = "Reversed")
Transposing
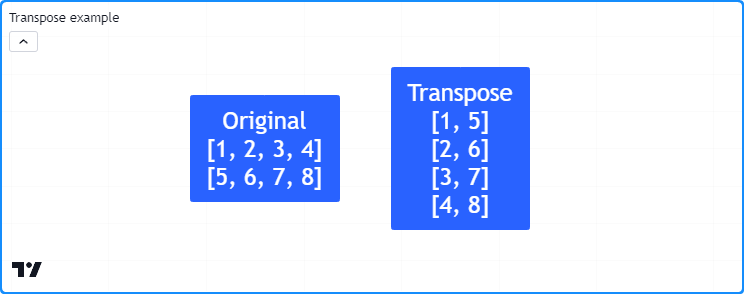
Transposing a matrix is a fundamental operation that flips all rows and columns in a matrix about its main diagonal (the diagonal vector of all values in which the row index equals the column index). This process produces a new matrix with reversed row and column dimensions, known as the transpose. Scripts can calculate the transpose of a matrix using matrix.transpose().
For any m-row, n-column matrix, the matrix returned from matrix.transpose() will have n rows and m columns. All elements in a matrix at the i-th row and j-th column correspond to the elements in its transpose at the j-th row and i-th column.
This example declares a 2x4 m matrix, calculates its transpose using the
m.transpose() method,
and displays both matrices on the chart using our custom debugLabel() method. As we can see below,
the transposed matrix has a 4x2 shape, and the rows of the transpose match the columns of the original:
//@version=5
indicator("Transpose example")

//@function Displays the rows of a matrix in a label with a note.
//@param    this The matrix to display.
//@param    barIndex The `bar_index` to display the label at.
//@param    bgColor The background color of the label.
//@param    textColor The color of the label's text.
//@param    note The text to display above the rows.
method debugLabel(
     matrix<float> this, int barIndex = bar_index, color bgColor = color.blue,
     color textColor = color.white, string note = ""
 ) =>
    labelText = note + "\n" + str.tostring(this)
    if barstate.ishistory
        label.new(
             barIndex, 0, labelText, color = bgColor, style = label.style_label_center,
             textcolor = textColor, size = size.huge
         )

//@variable A 2x4 matrix.
matrix<int> m = matrix.new<int>()

// Add columns to `m`.
m.add_col(0, array.from(1, 5))
m.add_col(1, array.from(2, 6))
m.add_col(2, array.from(3, 7))
m.add_col(3, array.from(4, 8))

//@variable The transpose of `m`. Has a 4x2 shape.
matrix<int> mt = m.transpose()

if bar_index == last_bar_index - 1
    m.debugLabel(note = "Original")
    mt.debugLabel(bar_index + 10, note = "Transpose")
Sorting
Scripts can sort the contents of a matrix via
matrix.sort().
Unlike array.sort(),
which sorts elements, this function organizes all rows in a matrix in a specified order
(order.ascending by default)
based on the values in a specified column.
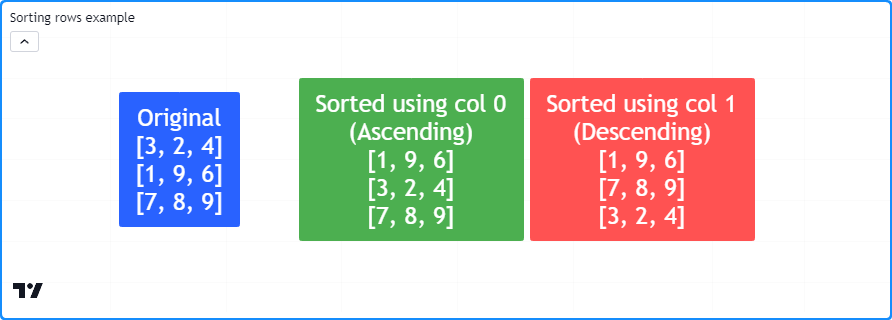
This script declares a 3x3 m matrix, sorts the rows of the m1 copy in ascending order based on the
first column, then sorts the rows of the m2 copy in descending order based on the second column. It
displays the original matrix and sorted copies in labels using our debugLabel() method:
//@version=5
indicator("Sorting rows example")

//@function Displays the rows of a matrix in a label with a note.
//@param    this The matrix to display.
//@param    barIndex The `bar_index` to display the label at.
//@param    bgColor The background color of the label.
//@param    textColor The color of the label's text.
//@param    note The text to display above the rows.
method debugLabel(
     matrix<float> this, int barIndex = bar_index, color bgColor = color.blue,
     color textColor = color.white, string note = ""
 ) =>
    labelText = note + "\n" + str.tostring(this)
    if barstate.ishistory
        label.new(
             barIndex, 0, labelText, color = bgColor, style = label.style_label_center,
             textcolor = textColor, size = size.huge
         )

//@variable A 3x3 matrix.
matrix<int> m = matrix.new<int>()

if bar_index == last_bar_index - 1
    // Add rows to `m`.
    m.add_row(0, array.from(3, 2, 4))
    m.add_row(1, array.from(1, 9, 6))
    m.add_row(2, array.from(7, 8, 9))
    m.debugLabel(note = "Original")

    // Copy `m` and sort rows in ascending order based on the first column (default).
    matrix<int> m1 = m.copy()
    m1.sort()
    m1.debugLabel(bar_index + 10, color.green, note = "Sorted using col 0\n(Ascending)")

    // Copy `m` and sort rows in descending order based on the second column.
    matrix<int> m2 = m.copy()
    m2.sort(1, order.descending)
    m2.debugLabel(bar_index + 20, color.red, note = "Sorted using col 1\n(Descending)")
It’s important to note that matrix.sort() does not sort the columns of a matrix. However, one can use this function to sort matrix columns with the help of matrix.transpose().
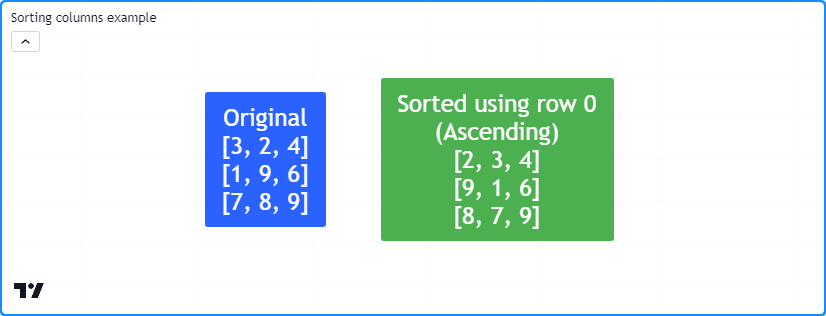
As an example, this script contains a sortColumns() method that uses the
sort()
method to sort the transpose
of a matrix using the column corresponding to the row of the original matrix. The script uses this method
to sort the m matrix based on the contents of its first row:
//@version=5
indicator("Sorting columns example")

//@function Displays the rows of a matrix in a label with a note.
//@param    this The matrix to display.
//@param    barIndex The `bar_index` to display the label at.
//@param    bgColor The background color of the label.
//@param    textColor The color of the label's text.
//@param    note The text to display above the rows.
method debugLabel(
     matrix<float> this, int barIndex = bar_index, color bgColor = color.blue,
     color textColor = color.white, string note = ""
 ) =>
    labelText = note + "\n" + str.tostring(this)
    if barstate.ishistory
        label.new(
             barIndex, 0, labelText, color = bgColor, style = label.style_label_center,
             textcolor = textColor, size = size.huge
         )

//@function Sorts the columns of `this` matrix based on the values in the specified `row`.
method sortColumns(matrix<int> this, int row = 0, bool ascending = true) =>
    //@variable The transpose of `this` matrix.
    matrix<int> thisT = this.transpose()
    //@variable Is `order.ascending` when `ascending` is `true`, `order.descending` otherwise.
    order = ascending ? order.ascending : order.descending
    // Sort the rows of `thisT` using the `row` column.
    thisT.sort(row, order)
    //@variable A copy of `this` matrix with sorted columns.
    result = thisT.transpose()

//@variable A 3x3 matrix.
matrix<int> m = matrix.new<int>()

if bar_index == last_bar_index - 1
    // Add rows to `m`.
    m.add_row(0, array.from(3, 2, 4))
    m.add_row(1, array.from(1, 9, 6))
    m.add_row(2, array.from(7, 8, 9))
    m.debugLabel(note = "Original")

    // Sort the columns of `m` based on the first row and display the result.
    m.sortColumns(0).debugLabel(bar_index + 10, note = "Sorted using row 0\n(Ascending)")
Concatenating
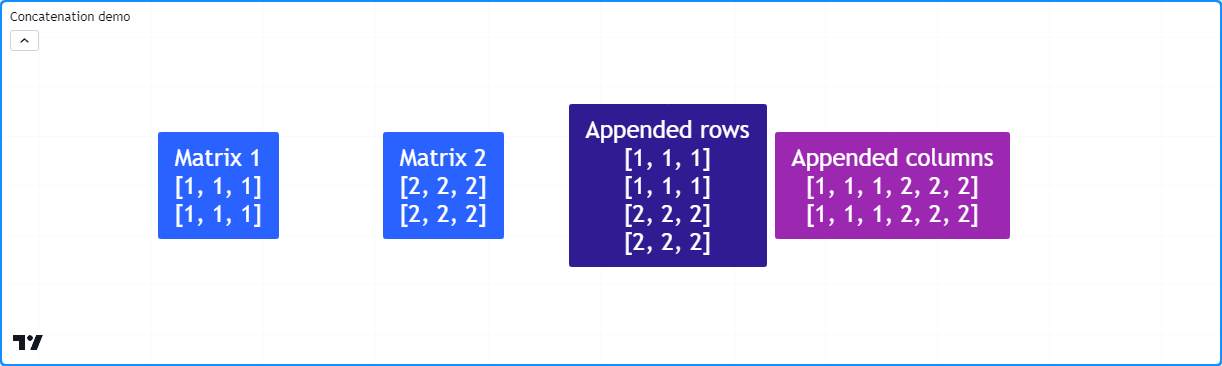
Scripts can concatenate two matrices using matrix.concat().
This function appends the rows of an id2 matrix to the end of an id1 matrix with the same number of columns.
To create a matrix with elements representing the columns of a matrix appended to another, transpose both matrices, use matrix.concat() on the transposed matrices, then transpose() the result.
For example, this script appends the rows of the m2 matrix to the m1 matrix and appends their columns using transposed
copies of the matrices. It displays the m1 and m2 matrices and the results after concatenating their rows and columns
in labels using the custom debugLabel() method:
//@version=5
indicator("Concatenation demo")

//@function Displays the rows of a matrix in a label with a note.
//@param    this The matrix to display.
//@param    barIndex The `bar_index` to display the label at.
//@param    bgColor The background color of the label.
//@param    textColor The color of the label's text.
//@param    note The text to display above the rows.
method debugLabel(
     matrix<float> this, int barIndex = bar_index, color bgColor = color.blue,
     color textColor = color.white, string note = ""
 ) =>
    labelText = note + "\n" + str.tostring(this)
    if barstate.ishistory
        label.new(
             barIndex, 0, labelText, color = bgColor, style = label.style_label_center,
             textcolor = textColor, size = size.huge
         )

//@variable A 2x3 matrix filled with 1s.
matrix<int> m1 = matrix.new<int>(2, 3, 1)
//@variable A 2x3 matrix filled with 2s.
matrix<int> m2 = matrix.new<int>(2, 3, 2)

//@variable The transpose of `m1`.
t1 = m1.transpose()
//@variable The transpose of `m2`.
t2 = m2.transpose()

if bar_index == last_bar_index - 1
    // Display the original matrices.
    m1.debugLabel(note = "Matrix 1")
    m2.debugLabel(bar_index + 10, note = "Matrix 2")
    // Append the rows of `m2` to the end of `m1` and display `m1`.
    m1.concat(m2)
    m1.debugLabel(bar_index + 20, color.blue, note = "Appended rows")
    // Append the rows of `t2` to the end of `t1`, then display the transpose of `t1.
    t1.concat(t2)
    t1.transpose().debugLabel(bar_index + 30, color.purple, note = "Appended columns")
Matrix calculations
Element-wise calculations
Pine scripts can calculate the average, minimum, maximum, and mode of all elements within a matrix via
matrix.avg(),
matrix.min(),
matrix.max(),
and matrix.mode().
These functions operate the same as their array.* equivalents, allowing users to run element-wise calculations
on a matrix, its submatrices, and its rows and columns
using the same syntax. For example, the built-in *.avg() functions called on a 3x3 matrix with values 1-9 and an
array with the same nine elements will both return a value of 5.
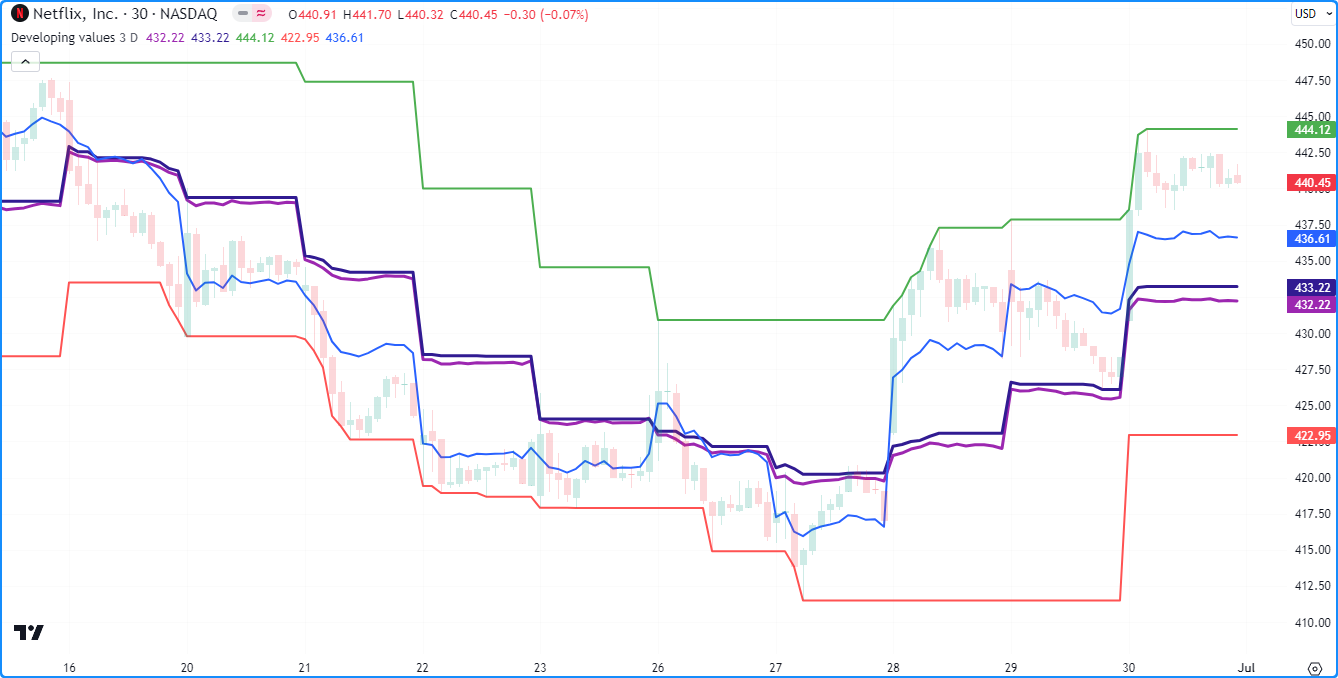
The script below uses *.avg(), *.max(), and *.min() methods to calculate developing averages and extremes of OHLC data
in a period. It adds a new column of open,
high,
low, and
close values to the end of the ohlcData matrix
whenever queueColumn is true. When false, the script uses the
get() and
set() matrix methods to adjust the elements in
the last column for developing HLC values in the current period. It uses the ohlcData matrix, a
submatrix(), and
row() and
col() arrays to calculate the developing OHLC4
and HL2 averages over length periods, the maximum high and minimum low over length periods, and the current period’s
developing OHLC4 price:
//@version=5
indicator("Element-wise calculations example", "Developing values", overlay = true)

//@variable The number of data points in the averages.
int length = input.int(3, "Length", 1)
//@variable The timeframe of each reset period.
string timeframe = input.timeframe("D", "Reset Timeframe")

//@variable A 4x`length` matrix of OHLC values.
var matrix<float> ohlcData = matrix.new<float>(4, length)

//@variable Is `true` at the start of a new bar at the `timeframe`.
bool queueColumn = timeframe.change(timeframe)

if queueColumn
    // Add new values to the end column of `ohlcData`.
    ohlcData.add_col(length, array.from(open, high, low, close))
    // Remove the oldest column from `ohlcData`.
    ohlcData.remove_col(0)
else
    // Adjust the last element of column 1 for new highs.
    if high > ohlcData.get(1, length - 1)
        ohlcData.set(1, length - 1, high)
    // Adjust the last element of column 2 for new lows.
    if low < ohlcData.get(2, length - 1)
        ohlcData.set(2, length - 1, low)
    // Adjust the last element of column 3 for the new closing price.
    ohlcData.set(3, length - 1, close)

//@variable The `matrix.avg()` of all elements in `ohlcData`.
avgOHLC4 = ohlcData.avg()
//@variable The `matrix.avg()` of all elements in rows 1 and 2, i.e., the average of all `high` and `low` values.
avgHL2   = ohlcData.submatrix(from_row = 1, to_row = 3).avg()
//@variable The `matrix.max()` of all values in `ohlcData`. Equivalent to `ohlcData.row(1).max()`.
maxHigh = ohlcData.max()
//@variable The `array.min()` of all `low` values in `ohlcData`. Equivalent to `ohlcData.min()`.
minLow = ohlcData.row(2).min()
//@variable The `array.avg()` of the last column in `ohlcData`, i.e., the current OHLC4.
ohlc4Value = ohlcData.col(length - 1).avg()

plot(avgOHLC4, "Average OHLC4", color.purple, 2)
plot(avgHL2, "Average HL2", color.navy, 2)
plot(maxHigh, "Max High", color.green)
plot(minLow, "Min Low", color.red)
plot(ohlc4Value, "Current OHLC4", color.blue)
- Note that:
- In this example, we used array.*() and matrix.*() methods interchangeably to demonstrate their similarities in syntax and behavior.
- Users can calculate the matrix equivalent of array.sum() by multiplying the matrix.avg() by the matrix.elements_count().
Special calculations
Pine Script™ features several built-in functions for performing essential matrix arithmetic and linear algebra operations, including matrix.sum(), matrix.diff(), matrix.mult(), matrix.pow(), matrix.det(), matrix.inv(), matrix.pinv(), matrix.rank(), matrix.trace(), matrix.eigenvalues(), matrix.eigenvectors(), and matrix.kron(). These functions are advanced features that facilitate a variety of matrix calculations and transformations.
Below, we explain a few fundamental functions with some basic examples.
`matrix.sum()` and `matrix.diff()`
Scripts can perform addition and subtraction of two matrices with the same shape or a matrix and a scalar value
using the matrix.sum() and
matrix.diff() functions. These functions
use the values from the id2 matrix or scalar to add to or subtract from the elements in id1.
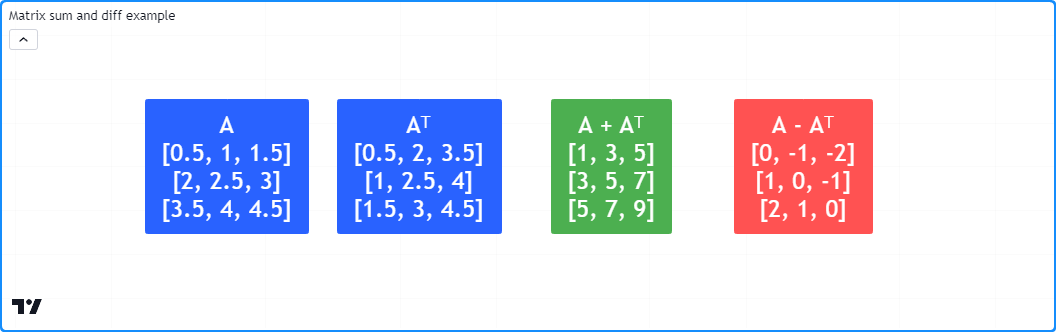
This script demonstrates a simple example of matrix addition and subtraction in Pine. It creates a 3x3 matrix, calculates its transpose, then calculates the matrix.sum() and matrix.diff() of the two matrices. This example displays the original matrix, its transpose, and the resulting sum and difference matrices in labels on the chart:
//@version=5
indicator("Matrix sum and diff example")

//@function Displays the rows of a matrix in a label with a note.
//@param    this The matrix to display.
//@param    barIndex The `bar_index` to display the label at.
//@param    bgColor The background color of the label.
//@param    textColor The color of the label's text.
//@param    note The text to display above the rows.
method debugLabel(
     matrix<float> this, int barIndex = bar_index, color bgColor = color.blue,
     color textColor = color.white, string note = ""
 ) =>
    labelText = note + "\n" + str.tostring(this)
    if barstate.ishistory
        label.new(
             barIndex, 0, labelText, color = bgColor, style = label.style_label_center,
             textcolor = textColor, size = size.huge
         )

//@variable A 3x3 matrix.
m = matrix.new<float>()

// Add rows to `m`.
m.add_row(0, array.from(0.5, 1.0, 1.5))
m.add_row(1, array.from(2.0, 2.5, 3.0))
m.add_row(2, array.from(3.5, 4.0, 4.5))

if bar_index == last_bar_index - 1
    // Display `m`.
    m.debugLabel(note = "A")
    // Get and display the transpose of `m`.
    matrix<float> t = m.transpose()
    t.debugLabel(bar_index + 10, note = "Aᵀ")
    // Calculate the sum of the two matrices. The resulting matrix is symmetric.
    matrix.sum(m, t).debugLabel(bar_index + 20, color.green, note = "A + Aᵀ")
    // Calculate the difference between the two matrices. The resulting matrix is antisymmetric.
    matrix.diff(m, t).debugLabel(bar_index + 30, color.red, note = "A - Aᵀ")
- Note that:
- In this example, we’ve labeled the original matrix as “A” and the transpose as “AT”.
- Adding “A” and “AT” produces a symmetric matrix, and subtracting them produces an antisymmetric matrix.
`matrix.mult()`
Scripts can multiply two matrices via the matrix.mult() function. This function also facilitates the multiplication of a matrix by an array or a scalar value.
In the case of multiplying two matrices, unlike addition and subtraction, matrix multiplication does not require two matrices
to share the same shape. However, the number of columns in the first matrix must equal the number of rows in the second one.
The resulting matrix returned by matrix.mult()
will contain the same number of rows as id1 and the same number of columns as id2. For instance, a 2x3 matrix multiplied
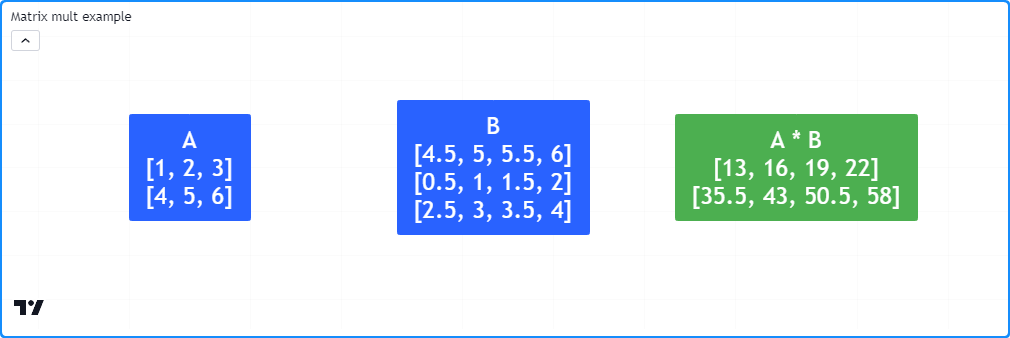
by a 3x4 matrix will produce a matrix with two rows and four columns, as shown below. Each value within the resulting matrix is the
dot product of the corresponding row in id1 and column in id2:
//@version=5
indicator("Matrix mult example")

//@function Displays the rows of a matrix in a label with a note.
//@param    this The matrix to display.
//@param    barIndex The `bar_index` to display the label at.
//@param    bgColor The background color of the label.
//@param    textColor The color of the label's text.
//@param    note The text to display above the rows.
method debugLabel(
     matrix<float> this, int barIndex = bar_index, color bgColor = color.blue,
     color textColor = color.white, string note = ""
 ) =>
    labelText = note + "\n" + str.tostring(this)
    if barstate.ishistory
        label.new(
             barIndex, 0, labelText, color = bgColor, style = label.style_label_center,
             textcolor = textColor, size = size.huge
         )

//@variable A 2x3 matrix.
a = matrix.new<float>()
//@variable A 3x4 matrix.
b = matrix.new<float>()

// Add rows to `a`.
a.add_row(0, array.from(1, 2, 3))
a.add_row(1, array.from(4, 5, 6))

// Add rows to `b`.
b.add_row(0, array.from(0.5, 1.0, 1.5, 2.0))
b.add_row(1, array.from(2.5, 3.0, 3.5, 4.0))
b.add_row(0, array.from(4.5, 5.0, 5.5, 6.0))

if bar_index == last_bar_index - 1
    //@variable The result of `a` * `b`.
    matrix<float> ab = a.mult(b)
    // Display `a`, `b`, and `ab` matrices.
    debugLabel(a, note = "A")
    debugLabel(b, bar_index + 10, note = "B")
    debugLabel(ab, bar_index + 20, color.green, note = "A * B")
- Note that:
- In contrast to the multiplication of scalars, matrix multiplication is non-commutative, i.e.,
matrix.mult(a, b)does not necessarily produce the same result asmatrix.mult(b, a). In the context of our example, the latter will raise a runtime error because the number of columns inbdoesn’t equal the number of rows ina.
- In contrast to the multiplication of scalars, matrix multiplication is non-commutative, i.e.,
When multiplying a matrix and an array, this function
treats the operation the same as multiplying id1 by a single-column matrix, but it returns an
array with the same number of elements as the number
of rows in id1. When matrix.mult() passes
a scalar as its id2 value, the function returns a new matrix whose elements are the elements in id1 multiplied by the id2 value.
`matrix.det()`
A determinant is a scalar value associated with a square matrix that describes some of its characteristics, namely its invertibility. If a matrix has an inverse, its determinant is nonzero. Otherwise, the matrix is singular (non-invertible). Scripts can calculate the determinant of a matrix via matrix.det().
Programmers can use determinants to detect similarities between matrices, identify full-rank and rank-deficient matrices, and solve systems of linear equations, among other applications.
For example, this script utilizes determinants to solve a system of linear equations with a matching number of unknown values using
Cramer’s rule. The user-defined solve() function returns an
array containing solutions for each unknown value in the system,
where the n-th element of the array is the determinant of the coefficient matrix with the n-th column replaced by the column of constants
divided by the determinant of the original coefficients.
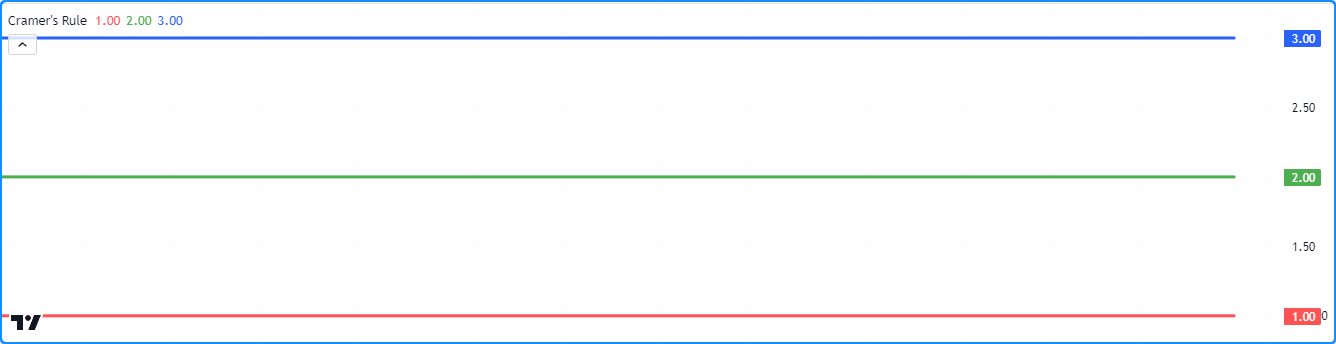
In this script, we’ve defined the matrix m that holds coefficients and constants for these three equations:
3 * x0 + 4 * x1 - 1 * x2 = 8
5 * x0 - 2 * x1 + 1 * x2 = 4
2 * x0 - 2 * x1 + 1 * x2 = 1
The solution to this system is (x0 = 1, x1 = 2, x2 = 3). The script calculates these values from m via m.solve() and plots them on the chart:
//@version=5
indicator("Determinants example", "Cramer's Rule")

//@function Solves a system of linear equations with a matching number of unknowns using Cramer's rule.
//@param    this An augmented matrix containing the coefficients for each unknown and the results of
//          the equations. For example, a row containing the values 2, -1, and 3 represents the equation
//          `2 * x0 + (-1) * x1 = 3`, where `x0` and `x1` are the unknown values in the system.
//@returns  An array containing solutions for each variable in the system.
solve(matrix<float> this) =>
    //@variable The coefficient matrix for the system of equations.
    matrix<float> coefficients = this.submatrix(from_column = 0, to_column = this.columns() - 1)
    //@variable The array of resulting constants for each equation.
    array<float> constants = this.col(this.columns() - 1)
    //@variable An array containing solutions for each unknown in the system.
    array<float> result = array.new<float>()

    //@variable The determinant value of the coefficient matrix.
    float baseDet = coefficients.det()
    matrix<float> modified = na
    for col = 0 to coefficients.columns() - 1
        modified := coefficients.copy()
        modified.add_col(col, constants)
        modified.remove_col(col + 1)

        // Calculate the solution for the column's unknown by dividing the determinant of `modified` by the `baseDet`.
        result.push(modified.det() / baseDet)

    result

//@variable A 3x4 matrix containing coefficients and results for a system of three equations.
m = matrix.new<float>()

// Add rows for the following equations:
// Equation 1: 3 * x0 + 4 * x1 - 1 * x2 = 8
// Equation 2: 5 * x0 - 2 * x1 + 1 * x2 = 4
// Equation 3: 2 * x0 - 2 * x1 + 1 * x2 = 1
m.add_row(0, array.from(3.0, 4.0, -1.0, 8.0))
m.add_row(1, array.from(5.0, -2.0, 1.0, 4.0))
m.add_row(2, array.from(2.0, -2.0, 1.0, 1.0))

//@variable An array of solutions to the unknowns in the system of equations represented by `m`.
solutions = solve(m)

plot(solutions.get(0), "x0", color.red, 3)   // Plots 1.
plot(solutions.get(1), "x1", color.green, 3) // Plots 2.
plot(solutions.get(2), "x2", color.blue, 3)  // Plots 3.
- Note that:
- Solving systems of equations is particularly useful for regression analysis, e.g., linear and polynomial regression.
- Cramer’s rule works fine for small systems of equations. However, it’s computationally inefficient on larger systems. Other methods, such as Gaussian elimination, are often preferred for such use cases.
`matrix.inv()` and `matrix.pinv()`
For any non-singular square matrix, there is an inverse matrix that yields the identity matrix when multiplied by the original. Inverses have utility in various matrix transformations and solving systems of equations. Scripts can calculate the inverse of a matrix when one exists via the matrix.inv() function.
For singular (non-invertible) matrices, one can calculate a generalized inverse (pseudoinverse), regardless of whether the matrix is square or has a nonzero determinant, via the matrix.pinv() function. Keep in mind that unlike a true inverse, the product of a pseudoinverse and the original matrix does not necessarily equal the identity matrix unless the original matrix is invertible.
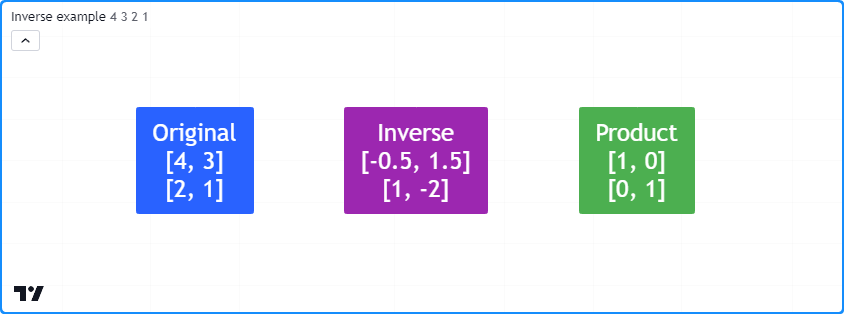
The following example forms a 2x2 m matrix from user inputs, then uses the
m.inv() and
m.pinv() methods
to calculate the inverse or pseudoinverse of m. The script displays the original matrix,
its inverse or pseudoinverse, and their product in labels on the chart:
//@version=5
indicator("Inverse example")

// Element inputs for the 2x2 matrix.
float r0c0 = input.float(4.0, "Row 0, Col 0")
float r0c1 = input.float(3.0, "Row 0, Col 1")
float r1c0 = input.float(2.0, "Row 1, Col 0")
float r1c1 = input.float(1.0, "Row 1, Col 1")

//@function Displays the rows of a matrix in a label with a note.
//@param    this The matrix to display.
//@param    barIndex The `bar_index` to display the label at.
//@param    bgColor The background color of the label.
//@param    textColor The color of the label's text.
//@param    note The text to display above the rows.
method debugLabel(
     matrix<float> this, int barIndex = bar_index, color bgColor = color.blue,
     color textColor = color.white, string note = ""
 ) =>
    labelText = note + "\n" + str.tostring(this)
    if barstate.ishistory
        label.new(
             barIndex, 0, labelText, color = bgColor, style = label.style_label_center,
             textcolor = textColor, size = size.huge
         )

//@variable A 2x2 matrix of input values.
m = matrix.new<float>()

// Add input values to `m`.
m.add_row(0, array.from(r0c0, r0c1))
m.add_row(1, array.from(r1c0, r1c1))

//@variable Is `true` if `m` is square with a nonzero determinant, indicating invertibility.
bool isInvertible = m.is_square() and m.det()

//@variable The inverse or pseudoinverse of `m`.
mInverse = isInvertible ? m.inv() : m.pinv()

//@variable The product of `m` and `mInverse`. Returns the identity matrix when `isInvertible` is `true`.
matrix<float> product = m.mult(mInverse)

if bar_index == last_bar_index - 1
    // Display `m`, `mInverse`, and their `product`.
    m.debugLabel(note = "Original")
    mInverse.debugLabel(bar_index + 10, color.purple, note = isInvertible ? "Inverse" : "Pseudoinverse")
    product.debugLabel(bar_index + 20, color.green, note = "Product")
- Note that:
- This script will only call m.inv()
when
isInvertibleistrue, i.e., whenmis square and has a nonzero determinant. Otherwise, it uses m.pinv() to calculate the generalized inverse.
- This script will only call m.inv()
when
`matrix.rank()`
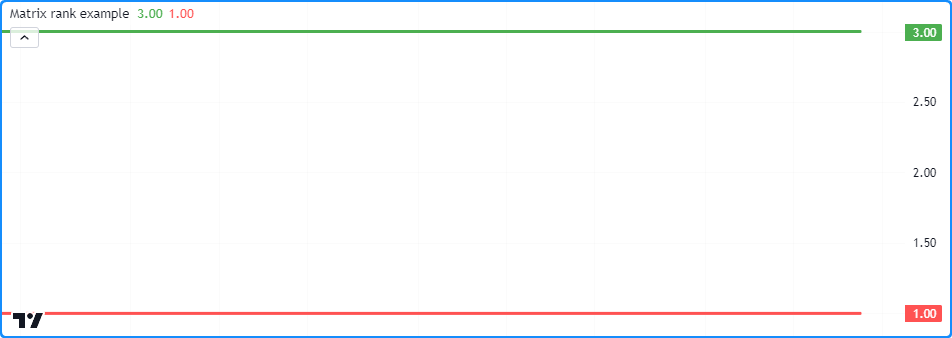
The rank of a matrix represents the number of linearly independent vectors (rows or columns) it contains. In essence, matrix rank measures the number of vectors one cannot express as a linear combination of others, or in other words, the number of vectors that contain unique information. Scripts can calculate the rank of a matrix via matrix.rank().
This script identifies the number of linearly independent vectors in two 3x3 matrices (m1 and m2) and plots the
values in a separate pane. As we see on the chart, the m1.rank()
value is 3 because each vector is unique. The m2.rank() value,
on the other hand, is 1 because it has just one unique vector:
//@version=5
indicator("Matrix rank example")

//@variable A 3x3 full-rank matrix.
m1 = matrix.new<float>()
//@variable A 3x3 rank-deficient matrix.
m2 = matrix.new<float>()

// Add linearly independent vectors to `m1`.
m1.add_row(0, array.from(3, 2, 3))
m1.add_row(1, array.from(4, 6, 6))
m1.add_row(2, array.from(7, 4, 9))

// Add linearly dependent vectors to `m2`.
m2.add_row(0, array.from(1, 2, 3))
m2.add_row(1, array.from(2, 4, 6))
m2.add_row(2, array.from(3, 6, 9))

// Plot `matrix.rank()` values.
plot(m1.rank(), color = color.green, linewidth = 3)
plot(m2.rank(), color = color.red, linewidth = 3)
- Note that:
- The highest rank value a matrix can have is the minimum of its number of rows and columns. A matrix with the maximum possible rank is known as a full-rank matrix, and any matrix without full rank is known as a rank-deficient matrix.
- The determinants of full-rank square matrices are nonzero, and such matrices have inverses. Conversely, the determinant of a rank-deficient matrix is always 0.
- For any matrix that contains nothing but the same value in each of its elements (e.g., a matrix filled with 0), the rank is always 0 since none of the vectors hold unique information. For any other matrix with distinct values, the minimum possible rank is 1.
Error handling
In addition to usual compiler errors, which occur during a script’s compilation due to improper syntax, scripts using matrices can raise specific runtime errors during their execution. When a script raises a runtime error, it displays a red exclamation point next to the script title. Users can view the error message by clicking this icon.
In this section, we discuss runtime errors that users may encounter while utilizing matrices in their scripts.
The row/column index (xx) is out of bounds, row/column size is (yy).
This runtime error occurs when trying to access indices outside the matrix dimensions with functions including matrix.get(), matrix.set(), matrix.fill(), and matrix.submatrix(), as well as some of the functions relating to the rows and columns of a matrix.
For example, this code contains two lines that will produce this runtime error. The
m.set() method references a row
index that doesn’t exist (2). The m.submatrix()
method references all column indices up to to_column - 1. A to_column value of 4 results in a runtime
error because the last column index referenced (3) does not exist in m:
//@version=5
indicator("Out of bounds demo")

//@variable A 2x3 matrix with a max row index of 1 and max column index of 2.
matrix<float> m = matrix.new<float>(2, 3, 0.0)

m.set(row = 2, column = 0, value = 1.0)     // The `row` index is out of bounds on this line. The max value is 1.
m.submatrix(from_column = 1, to_column = 4) // The `to_column` index is invalid on this line. The max value is 3.

if bar_index == last_bar_index - 1
    label.new(bar_index, 0, str.tostring(m), color = color.navy, textcolor = color.white, size = size.huge)
Users can avoid this error in their scripts by ensuring their function calls do not reference indices greater than or equal to the number of rows/columns.
The array size does not match the number of rows/columns in the matrix.
When using matrix.add_row() and matrix.add_col() functions to insert rows and columns into a non-empty matrix, the size of the inserted array must align with the matrix dimensions. The size of an inserted row must match the number of columns, and the size of an inserted column must match the number of rows. Otherwise, the script will raise this runtime error. For example:
//@version=5
indicator("Invalid array size demo")

// Declare an empty matrix.
m = matrix.new<float>()

m.add_col(0, array.from(1, 2))    // Add a column. Changes the shape of `m` to 2x1.
m.add_col(1, array.from(1, 2, 3)) // Raises a runtime error because `m` has 2 rows, not 3.

plot(m.col(0).get(1))
- Note that:
- When
mis empty, one can insert a row or column array of any size, as shown in the firstm.add_col()line.
- When
Cannot call matrix methods when the ID of matrix is ‘na’.
When a matrix variable is assigned to na, it means that the variable doesn’t reference an existing object.
Consequently, one cannot use built-in matrix.*() functions and methods with it. For example:
//@version=5
indicator("na matrix methods demo")

//@variable A `matrix` variable assigned to `na`.
matrix<float> m = na

mCopy = m.copy() // Raises a runtime error. You can't copy a matrix that doesn't exist.

if bar_index == last_bar_index - 1
    label.new(bar_index, 0, str.tostring(mCopy), color = color.navy, textcolor = color.white, size = size.huge)
To resolve this error, assign m to a valid matrix instance before using matrix.*() functions.
Matrix is too large. Maximum size of the matrix is 100,000 elements.
The total number of elements in a matrix
(matrix.elements_count())
cannot exceed 100,000, regardless of its shape. For example, this script will raise an error because it
inserts 1000 rows with 101 elements into the m matrix:
//@version=5
indicator("Matrix too large demo")

var matrix<float> m = matrix.new<float>()

if bar_index == 0
    for i = 1 to 1000
        // This raises an error because the script adds 101 elements on each iteration.
        // 1000 rows * 101 elements per row = 101000 total elements. This is too large.
        m.add_row(m.rows(), array.new<float>(101, i))

plot(m.get(0, 0))
The row/column index must be 0 <= from_row/column < to_row/column.
When using matrix.*() functions with from_row/column and to_row/column indices, the from_*
values must be less than the corresponding to_* values, with the minimum possible value being 0.
Otherwise, the script will raise a runtime error.
For example, this script shows an attempt to declare a submatrix
from a 4x4 m matrix with a from_row value of 2 and a to_row value of 2, which will result in
an error:
//@version=5
indicator("Invalid from_row, to_row demo")

//@variable A 4x4 matrix filled with a random value.
matrix<float> m = matrix.new<float>(4, 4, math.random())

matrix<float> mSub = m.submatrix(from_row = 2, to_row = 2) // Raises an error. `from_row` can't equal `to_row`.

plot(mSub.get(0, 0))
Matrices ‘id1’ and ‘id2’ must have an equal number of rows and columns to be added.
When using matrix.sum() and matrix.diff()
functions, the id1 and id2 matrices must have the same number of rows and the same number of columns.
Attempting to add or subtract two matrices with mismatched dimensions will raise an error, as demonstrated by this code:
//@version=5
indicator("Invalid sum dimensions demo")

//@variable A 2x3 matrix.
matrix<float> m1 = matrix.new<float>(2, 3, 1)
//@variable A 3x4 matrix.
matrix<float> m2 = matrix.new<float>(3, 4, 2)

mSum = matrix.sum(m1, m2) // Raises an error. `m1` and `m2` don't have matching dimensions.

plot(mSum.get(0, 0))
The number of columns in the ‘id1’ matrix must equal the number of rows in the matrix (or the number of elements in the array) ‘id2’.
When using matrix.mult() to multiply an id1 matrix by
an id2 matrix or array, the matrix.rows() or
array.size() of id2 must equal the
matrix.columns() in id1.
If they don’t align, the script will raise this error.
For example, this script tries to multiply two 2x3 matrices. While adding these matrices is possible, multiplying them is not:
//@version=5
indicator("Invalid mult dimensions demo")

//@variable A 2x3 matrix.
matrix<float> m1 = matrix.new<float>(2, 3, 1)
//@variable A 2x3 matrix.
matrix<float> m2 = matrix.new<float>(2, 3, 2)

mSum = matrix.mult(m1, m2) // Raises an error. The number of columns in `m1` and rows in `m2` aren't equal.

plot(mSum.get(0, 0))
Operation not available for non-square matrices.
Some matrix operations, including matrix.inv(),
matrix.det(),
matrix.eigenvalues(),
and matrix.eigenvectors()
only work with square matrices, i.e., matrices with the same number of rows and columns. When attempting to
execute such functions on non-square matrices, the script will raise an error stating the operation isn’t available
or that it cannot calculate the result for the matrix id. For example:
//@version=5
indicator("Non-square demo")

//@variable A 3x5 matrix.
matrix<float> m = matrix.new<float>(3, 5, 1)

plot(m.det()) // Raises a runtime error. You can't calculate the determinant of a 3x5 matrix.