Loops
Introduction
Loops are structures that repeatedly execute a block of statements based on specified criteria. They allow scripts to perform repetitive tasks without requiring duplicated lines of code. Pine Script® features three distinct loop types: for, while, and for…in.
Every loop structure in Pine Script consists of two main parts: a loop header and a loop body. The loop header determines the criteria under which the loop executes. The loop body is the indented block of code (local block) that the script executes on each loop cycle (iteration) as long as the header’s conditions remain valid. See the Common characteristics section to learn more.
Understanding when and how to use loops is essential for making the most of the power of Pine Script. Inefficient or unnecessary usage of loops can lead to suboptimal runtime performance. However, effectively using loops when necessary enables scripts to perform a wide range of calculations that would otherwise be impractical or impossible without them.
When loops are unnecessary
Pine’s execution model and time series structure make loops unnecessary in many situations.
When a user adds a Pine script to a chart, it runs within the equivalent of a large loop, executing its code once on every historical bar and realtime tick in the available data. Scripts can access the values from the executions on previous bars with the history-referencing operator, and calculated values can persist across executions when assigned to variables declared with the var or varip keywords. These capabilities enable scripts to utilize bar-by-bar calculations to accomplish various tasks instead of relying on explicit loops.
In addition, several built-ins, such as those in the ta.* namespace, are internally optimized to eliminate the need to use loops for various calculations.
Let’s consider a simple example demonstrating unnecessary loop usage in Pine Script. To calculate the average close over a specified number of bars, newcomers to Pine may write a code like the following, which uses a for loop to calculate the sum of historical values over lengthInput bars and divides the result by the lengthInput:
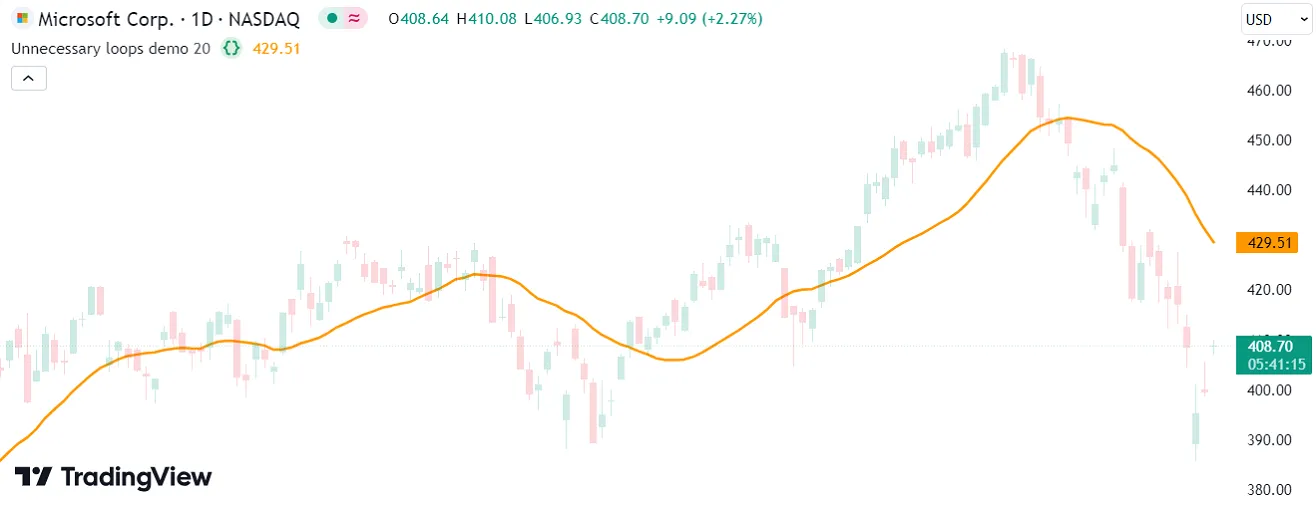
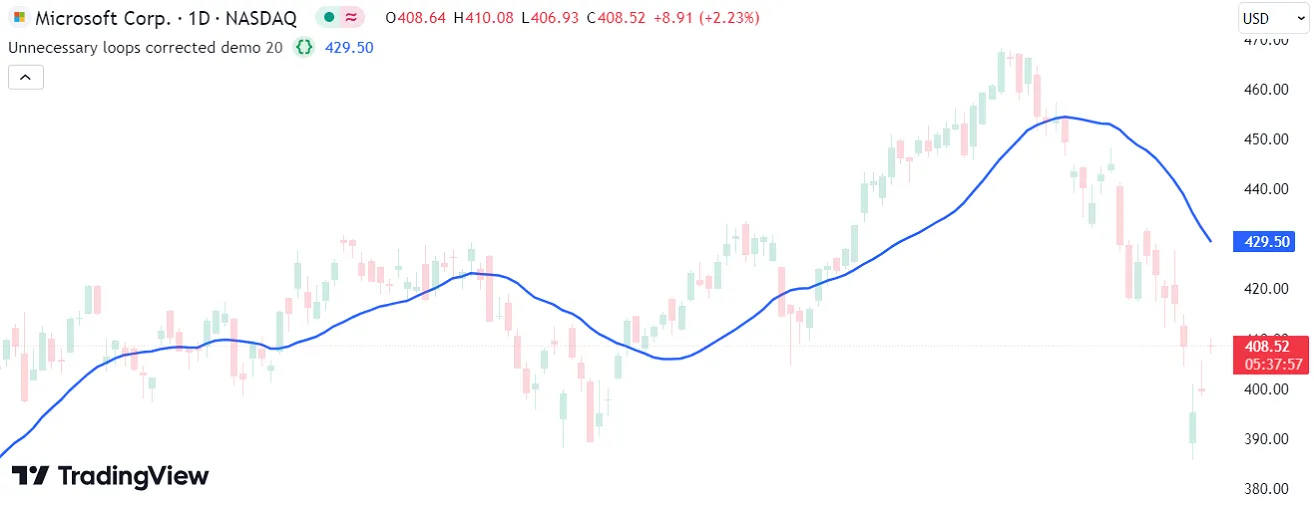
Using a for loop is an unnecessary, inefficient way to accomplish tasks like this in Pine. There are several ways to utilize the execution model and the available built-ins to eliminate this loop. Below, we replaced these calculations with a simple call to the ta.sma() function. This code is shorter, and it achieves the same result much more efficiently:
Note that:
- Users can see the substantial difference in efficiency between these two example scripts by analyzing their performance with the Pine Profiler.
When loops are necessary
Although Pine’s execution model, time series, and available built-ins often eliminate the need for loops in many cases, not all iterative tasks have loop-free alternatives. Loops are necessary for several types of tasks, including:
- Iterating through or manipulating collections (arrays, matrices, and maps)
- Performing calculations that one cannot accomplish with loop-free expressions or the available built-ins
- Looking back through history to analyze past bars with a reference value only available on the current bar
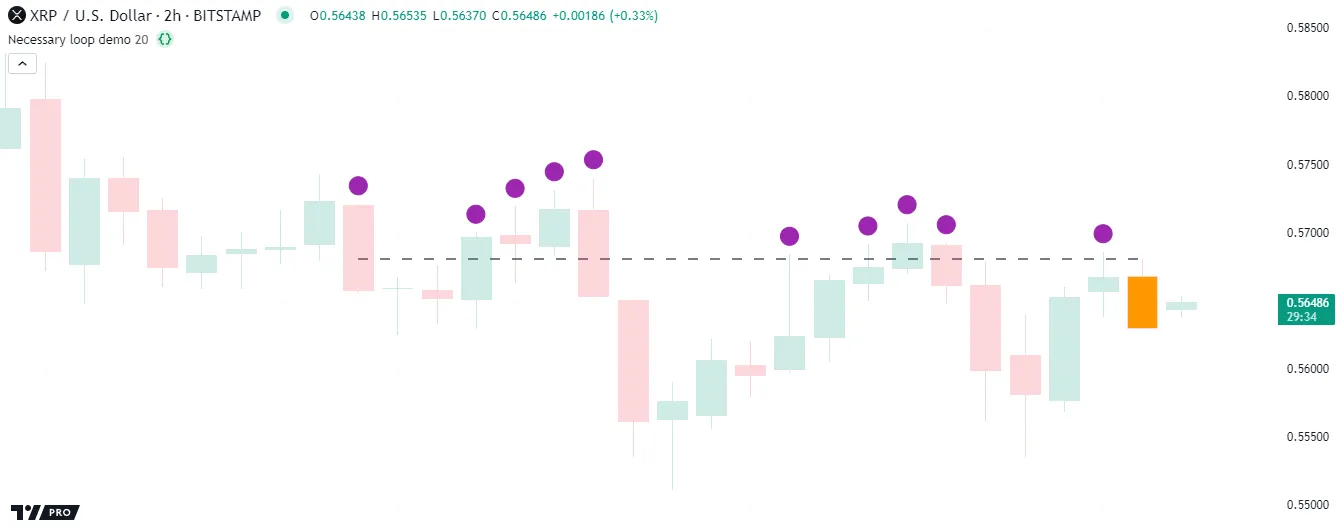
For example, a loop is necessary to identify which past bars’ high values are above the current bar’s high because the current value is not obtainable during a script’s executions on previous bars. The script can only access the current bar’s value while it executes on that bar, and it must look back through the historical series during that execution to compare the previous values.
The script below uses a for loop to compare the high values of lengthInput previous bars with the last historical bar’s high. Within the loop, it calls label.new() to draw a circular label above each past bar that has a high value exceeding that of the last historical bar:
Note that:
- Each iteration of the for loop retrieves a previous bar’s high with the history-referencing operator [], using the loop’s counter (
i) as the historical offset. The label.new() call also uses the counter to determine each label’s x-coordinate. - The indicator declaration statement includes
max_labels_count = 500, meaning the script can show up to 500 labels on the chart. - The script calls barcolor() to highlight the last historical chart bar, and it draws a horizontal line at that bar’s high for visual reference.
Common characteristics
The for, while, and for…in loop statements all have similarities in their structure, syntax, and general behavior. Before we explore each specific loop type, let’s familiarize ourselves with these characteristics.
Structure and syntax
In any loop statement, programmers define the criteria under which a script remains in a loop and performs iterations, where an iteration refers to one execution of the code within the loop’s local block (body). These criteria are part of the loop header. A script evaluates the header’s criteria before each iteration, only allowing new iterations to occur while they remain valid. When the header’s criteria are no longer valid, the script exits the loop and skips over its body.
The specific header syntax varies with each loop statement (for, while, or for…in) because each uses distinct criteria to control its iterations. Effective use of loops entails choosing the structure with control criteria best suited for a script’s required tasks. See the `for` loops, `while` loops, and `for…in` loops sections below for more information on each loop statement and its control criteria.
All loop statements in Pine Script follow the same general syntax:
[variables = | :=] loop_header statements | continue | break return_expressionWhere:
loop_headerrepresents the loop structure’s header statement, which defines the criteria that control the loop’s iterations.statementsrepresents the code statements and expressions within the loop’s body, i.e., the indented block of code beneath the loop header. All code within the body belongs to the loop’s local scope.continueandbreakare loop-specific keywords that control the flow of a loop’s iterations. Thecontinuekeyword instructs the script to skip the remainder of the current loop iteration and continue to the next iteration. Thebreakkeyword prompts the script to stop the current iteration and exit the loop entirely. See this section below for more information.return_expressionrefers to the last code line or block within the loop’s body. The loop returns the results from this code after the final iteration. If the loop skips parts of some iterations or stops prematurely due to acontinueorbreakstatement, the returned values or references are those of the latest iteration that evaluated this code. To use the loop’s returned results, assign them to a variable or tuple.variablesrepresents an optional variable or tuple to hold the values or references from the last evaluation of thereturn_expression. The script can assign the loop’s returned results to variables only if the results are not void. If the loop’s conditions prevent iteration, or if no iterations evaluate thereturn_expression, the variables’ assigned values and references are na.
Scope
All code lines that a script executes within a loop must have an indentation of four spaces or a tab relative to the loop’s header. The indented lines following the header define the loop’s body. This code represents a local block, meaning that all the definitions within the body are accessible only during the loop’s execution. In other words, the code within the loop’s body is part of its local scope.
Scripts can modify and reassign most variables from outer scopes inside a loop. However, any variables declared within the loop’s body strictly belong to that loop’s local scope. A script cannot access a loop’s declared variables outside its local block.
Note that:
- Variables declared within a loop’s header are also part of the local scope. For instance, a script cannot use the counter variable in a for loop anywhere but within the loop’s local block.
The body of any Pine loop statement can include conditional structures and nested loop statements. When a loop includes nested structures, each structure within the body maintains a distinct local scope. For example, variables declared within an outer loop’s scope are accessible to an inner loop. However, any variables declared within the inner loop’s scope are not accessible to the outer loop.
The simple example below demonstrates how a loop’s local scope works. This script calls label.new() within a for loop on the last historical bar to draw labels above lengthInput past bars. The color of each label depends on the labelColor variable declared within the loop’s local block, and each label’s location depends on the loop counter (i):
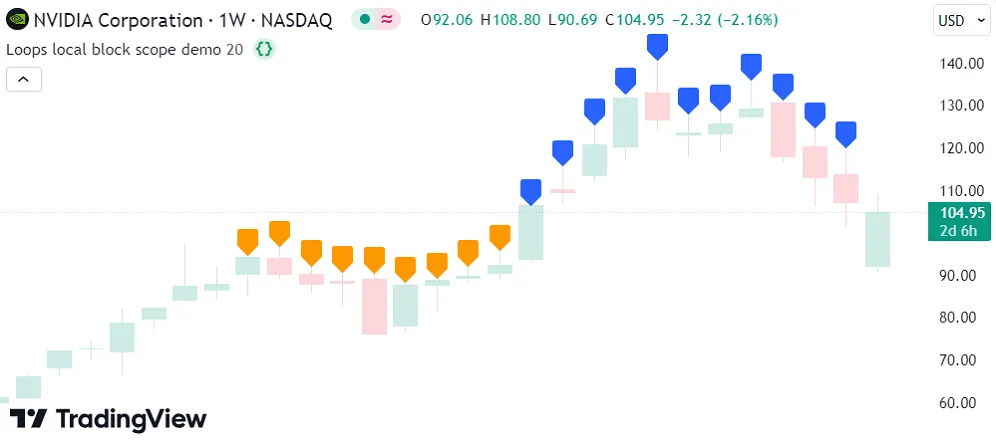
In the above code, the i and labelColor variables are only accessible to the for loop’s local scope. They are not usable within any outer scopes. Here, we added a label.new() call after the loop with bar_index - i as the x argument and labelColor as the color argument. This code causes a compilation error because neither i nor labelColor are valid variables in the outer scope:
Keywords and return expressions
Every loop in Pine Script implicitly returns values, references, or void. A loop’s returned results come from the latest execution of the last expression or nested structure within its body as of the final iteration. The results are usable only if they are not of the void type. Loops return na results for values or references when no iterations occur. Scripts can add a variable or tuple assignment to a loop statement to hold the returned results for use in additional calculations outside the loop’s local scope.
The values or references that a loop returns usually come from evaluating the last written expression or nested code block on the final iteration. However, a loop’s body can include continue and break keywords to control the flow of iterations beyond the criteria the loop header specifies, which can also affect the returned results. Programmers often include these keywords within conditional structures to control how iterations behave when certain conditions occur.
The continue keyword instructs a script to skip the remaining statements and expressions in the current loop iteration, re-evaluate the loop header’s criteria, and proceed to the next iteration. The script exits the loop if the header’s criteria do not allow another iteration.
The break keyword instructs a script to stop the loop entirely and immediately exit at that point without allowing any subsequent iterations. After breaking the loop, the script skips any remaining code within the loop’s body and does not re-evaluate the header’s criteria.
If a loop skips parts of iterations or stops prematurely due to a continue or break statement, it returns the values and references from the last iteration where the script evaluated the return expression. If the script did not evaluate the return expression across any of the loop’s iterations, the loop returns na results for all non-void types.
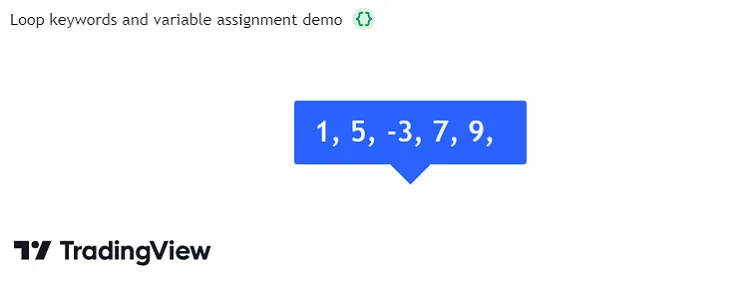
The example below selectively displays numbers from an array within a label on the last historical bar. It uses a for…in loop to iterate through the array’s elements and build a “string” to use as the displayed text. The loop’s body contains an if statement that controls the flow of specific iterations. If the number in the current iteration is 8, the script immediately exits the loop using the break keyword. Otherwise, if the number is even, it skips the rest of the current iteration and moves to the next one using the continue keyword.
If neither of the if statement’s conditions occur, the script evaluates the last expression within the loop’s body (i.e., the return expression), which converts the current number to a “string” and concatenates the result with the tempString value. The loop returns the last evaluated result from this expression after termination. The script assigns the returned value to the finalLabelText variable and uses that variable as the text argument in the label.new() call:
Note that:
- The label displays only odd numbers from the array because the script does not reassign the
tempStringwhen the loop iteration’snumberis even. However, it does not include the last odd number from the array (15) because the loop stops whennumber == 8, preventing iteration over the remainingrandomArrayelements. - When the script exits the loop due to the
breakkeyword, the loop’s return value becomes the last evaluated result from thetempStringreassignment expression. In this case, the last time that code executes is on the iteration wherenumber == 9.
for loops
The for loop statement creates a count-controlled loop, which uses a counter variable to manage the iterative executions of its local code block. The counter starts at a predefined initial value, and the loop increments or decrements the counter by a fixed amount after each iteration. The loop stops its iterations after the counter reaches a specified final value.
Pine Script uses the following syntax to define a for loop:
[variables = | :=] for counter = from_num to to_num [by step_num] statements | continue | break return_expressionWhere the following parts define the loop header:
counterrepresents the counter variable, which can be any valid identifier. The loop increments or decrements this variable’s value from the initial value (from_num) to the final value (to_num) by a fixed amount (step_num) after each iteration. The last possible iteration occurs when the variable’s value reaches theto_numvalue.from_numis thecountervariable’s initial value on the first iteration.to_numis the finalcountervalue for which the loop’s header allows a new iteration. The loop adjusts thecountervalue by thestep_numamount until it reaches or passes this value. If the script modifies theto_numduring a loop iteration, the loop header uses the new value to control the allowed subsequent iterations.step_numis a positive value representing the amount by which thecountervalue increases or decreases until it reaches or passes theto_numvalue. If thefrom_numvalue is greater than the initialto_numvalue, the loop subtracts this amount from thecountervalue after each iteration. Otherwise, the loop adds this amount after each iteration. The default is 1.
Refer to the Common characteristics section above for detailed information about the variables, statements, continue, break, and return_expression parts of the loop’s syntax.
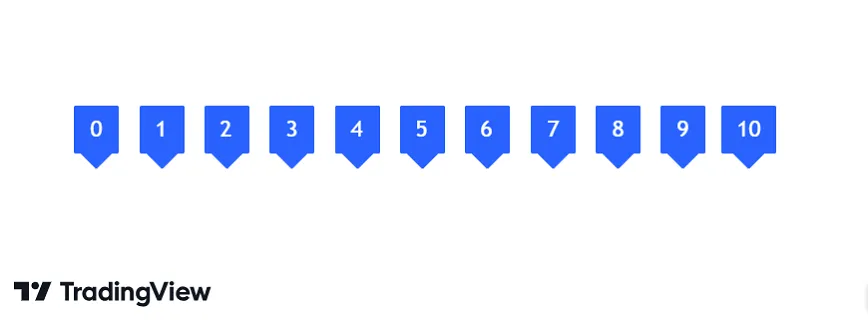
This simple script demonstrates a for loop that draws several labels at future bar indices during its execution on the last historical chart bar. The loop’s counter starts at 0, then increases by 1 until it reaches a value of 10, at which point the final iteration occurs:
Note that:
- The
ivariable represents the loop’s counter. This variable is local to the loop’s scope, meaning no outer scopes can access it. The code uses the variable within the loop’s body to determine the location and text of each label drawing. - Programmers often use
i,j, andkas loop counter identifiers. However, any valid variable name is allowed. For example, this code behaves the same if we name the counteroffsetinstead ofi. - The for loop structure automatically manages the counter variable. We do not need to define code in the loop’s body to increment its value.
The direction in which a for loop adjusts its counter depends on the initial from_num and to_num values in the loop’s header, and the direction does not change across iterations. The loop counts upward after each iteration when the to_num value is above the from_num value, as shown in the previous example. If the to_num value is below the from_num value, the loop counts downward instead.
The script below calculates and plots the volume-weighted moving average (VWMA) of open prices across a specified number of bars. Then, it uses a downward-counting for loop to compare the last historical bar’s value to the values from previous bars, starting with the oldest bar in the specified lookback window. On each loop iteration, the script retrieves a previous bar’s vwmaOpen value, calculates the difference from the current bar’s value, and displays the result in a label at the past bar’s opening price:

Note that:
- The script uses the loop’s counter (
i) to within the history-referencing operator to retrieve past values of thevwmaOpenseries. It also uses the counter to determine the location of each label drawing. - The loop in this example decreases the counter by one on each iteration because the final counter value in the loop’s header (
1) is less than the starting value (lookbackInput).
Programmers can use for loops to iterate through collections, such as arrays and matrices. The loop’s counter can serve as an index for retrieving or modifying a collection’s contents. For example, this code block uses array.get() inside a for loop to successively retrieve elements from an array:
Note that:
- Array indexing starts from 0, but the array.size() function counts array elements starting from 1. Therefore, we must subtract 1 from the array’s size to get the maximum index value. This way, the loop counter avoids representing an out-of-bounds index on the last loop iteration.
- The for…in loop statement is often the preferred way to loop through collections. However, programmers may prefer a for loop for some tasks, such as looping through stepped index values, iterating over a collection’s contents in reverse or a nonlinear order, and more. See the Looping through arrays and Looping through matrices sections to learn more about the best practices for looping through these collection types.
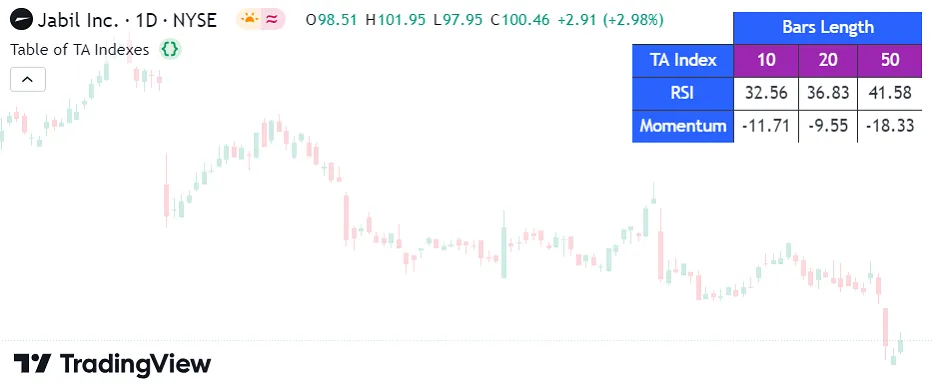
The script below executes ta.rsi() and ta.mom() calls to calculate the RSI and momentum of close prices over three different lengths (10, 20, and 50), then displays the results using a table on the last chart bar. It stores “string” values for the header title within arrays and the “float” values of the calculated indicators within a 2x3 matrix. The script uses a for loop to access the elements in the arrays and initialize the displayTable header cells. It then uses nested for loops to iterate over the row and column indices in the taMatrix, access elements, convert their values to strings, and populate the remaining table cells:
Note that:
- Both arrays of header names (
sideHeaderTitlesandtopHeaderTitles) contain the same number of elements, enabling the script to iterate through their contents simultaneously using a single for loop. - The nested for loops iterate over all the index values in the
taMatrix. The outer loop iterates over each row index, and the inner loop iterates over every column index on each outer loop iteration. - The script creates and displays the table only on the last historical bar and all realtime bars because the historical states of tables are never visible. See the Reducing drawing updates of the Profiling and optimization page for more information.
It’s important to note that a for loop’s header dynamically evaluates the to_num value at the start of every iteration. If the to_num argument is a variable and the script changes its value during an iteration, the loop uses the new value to update its stopping condition. Likewise, the stopping condition can change across iterations when the to_num argument is an expression or function call that depends on data modified in the loop’s scope, such as a call to array.size() on a locally resized array or str.length() on an adjusted string. Therefore, scripts can use for loops to perform iterative tasks where the exact number of required iterations is not predictable in advance, similar to while loops.
For example, the following script uses a dynamic for loop to determine the historical offset of the most recent bar whose close differs from the current bar’s close by at least one standard deviation. The script declares a barOffset variable with an initial value of zero and uses that variable to define the loop counter’s to_num boundary. Within the loop’s scope, the script increments the barOffset by one if the referenced bar’s close is not far enough from the current bar’s value. Each time the barOffset value increases, the loop increases its final counter value, allowing an extra iteration. The script plots the barOffset and the corresponding bar’s close for visual reference:

Note that:
- Changing the
to_numvalue on an iteration does not affect the established direction in which the loop adjusts its counter variable. For instance, if the loop in this example changedbarOffsetto -1 on any iteration, it would stop immediately after that iteration ends without reducing theivalue. - The script uses
force_overlay = truein the second plot() call to display the historical closing price on the main chart pane.
while loops
The while loop statement creates a condition-controlled loop, which uses a conditional expression to control the executions of its local block. The loop continues its iterations as long as the specified condition remains true.
Pine Script uses the following syntax to define a while loop:
[variables = | :=] while condition statements | continue | break return_expressionWhere the condition in the loop’s header can be a literal, variable, expression, or function call that returns a “bool” value.
Refer to the Common characteristics section above for detailed information about the variables, statements, continue, break, and return_expression parts of the loop’s syntax.
A while loop’s header evaluates its condition before each iteration. Consequently, when the script modifies the condition within an iteration, the loop’s header reflects those changes on the next iteration.
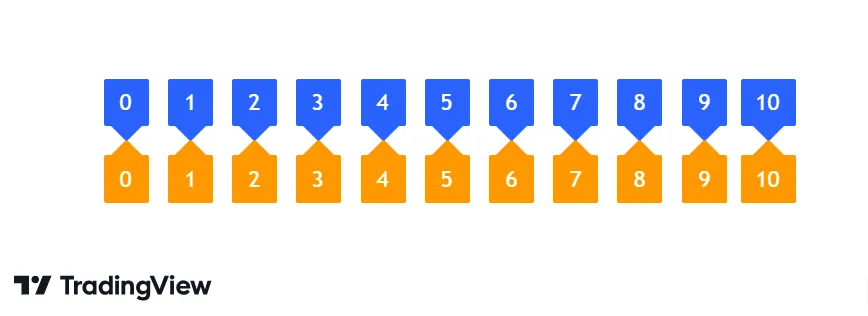
Depending on the specified condition in the loop header, a while loop can behave similarly to a for loop, continuing iteration until a counter variable reaches a specified limit. For example, the following script uses a for loop and while loop to perform the same task. Both loops draw a label displaying their respective counter value on each iteration:
Note that:
- When a while loop uses count-based logic, it must explicitly manage the user-specified counter within the local block. In contrast, a for loop increments its counter automatically.
- The script declares the variable the while loop uses as a counter outside the loop’s scope, meaning its value is usable in additional calculations after the loop terminates.
- If this code did not increment the
jvariable within the while loop’s body, the value would never reach 10, meaning the loop would run indefinitely until causing a runtime error.
Because a while loop’s execution depends on its condition remaining true, and the condition might not change on a specific iteration, the precise number of expected iterations might not be knowable before the loop begins. Therefore, while loops are often helpful in scenarios where the exact loop boundaries are unknown.
The script below tracks when the chart’s close crosses outside Keltner Channels with a user-specified length and channel width. When the price crosses outside the current bar’s channel, the script draws a box highlighting all the previous consecutive bars with close values within that price window. The script uses a while loop to analyze past bars’ prices and incrementally adjust the left side of each new box until the drawing covers all the latest consecutive bars in the current range:
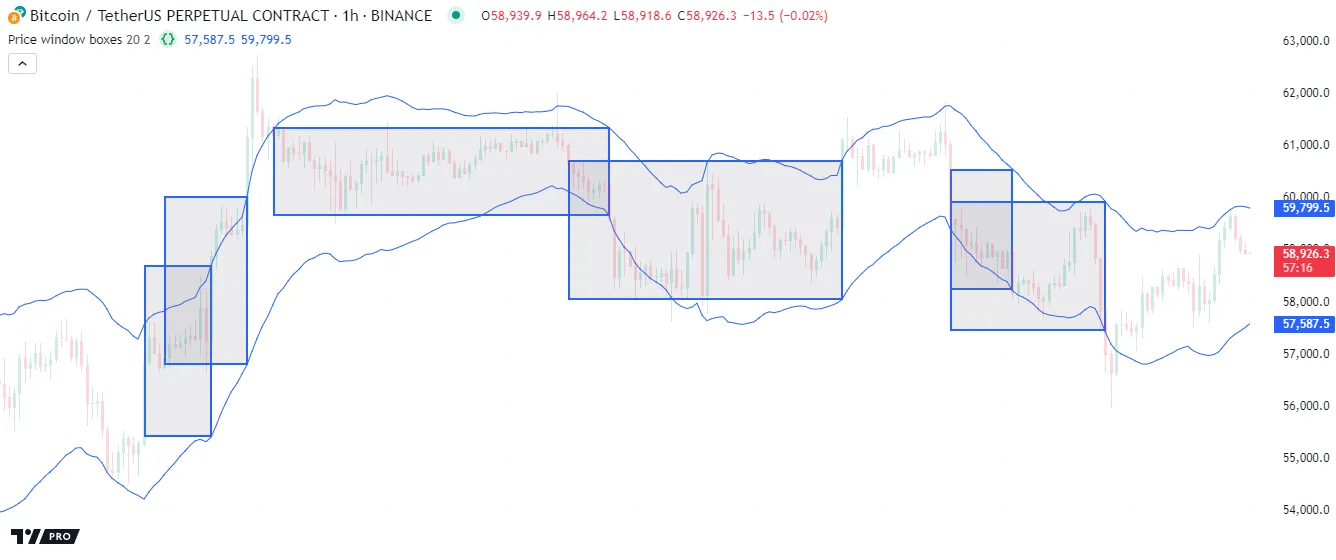
Note that:
- The left and right edges of boxes sit within the horizontal center of their respective bars, meaning that each drawing spans from the middle of the first consecutive bar to the middle of the last bar within each window.
- This script uses the
ivariable as a history-referencing index within the conditional expression the while loop checks on each iteration. The variable does not behave as a loop counter, as the iteration boundaries are unknown. The loop executes its local block repeatedly until the condition becomesfalse.
for...in loops
The for…in loop statement creates a collection-controlled loop, which uses the contents of a collection to control its iterations. This loop structure is often the preferred approach for looping through arrays, matrices, and maps.
A for…in loop traverses a collection in order, retrieving one of its stored items on each iteration. Therefore, the loop’s boundaries depend directly on the number of items (array elements, matrix rows, or map key-value pairs).
Pine Script features two general forms of the for…in loop statement. The first form uses the following syntax:
[variables = | :=] for item in collection_id statements | continue | break return_expressionWhere item is a variable that holds sequential values or references from the specified collection_id. The variable starts with the collection’s first item and takes on successive items in order after each iteration. This form is convenient when a script must access values from an array or matrix iteratively but does not require the item’s index in its calculations.
The second form has a slightly different syntax that includes a tuple in its header:
[variables = | :=] for [index, item] in collection_id statements | continue | break return_expressionWhere index is a variable that contains the index or key of the retrieved item. This form is convenient when a task requires using a collection’s items and their indices in iterative calculations. This form of the for…in loop is required when directly iterating through the contents of a map. See this section below for more information.
Refer to the Common characteristics section above for detailed information about the variables, statements, continue, break, and return_expression parts of the loop’s syntax.
The iterative behavior of a for…in loop depends on the type of collection the header specifies as the collection_id:
- When using an array in the header, the loop performs element-wise iteration, meaning the retrieved
itemon each iteration is one of the array’s elements. - When using a matrix in the header, the loop performs row-wise iteration, which means that each
itemrepresents a row array. - When using a map in the header, the loop performs pair-wise iteration, which retrieves a key and corresponding value on each iteration.
Looping through arrays
Pine scripts can iterate over the elements of arrays using any loop structure. However, the for…in loop is typically the most convenient because it automatically verifies the size of an array when controlling iterations. With other loop structures, programmers must carefully set the header’s boundaries or conditions to prevent the loop from attempting to access an element at a nonexistent index.
For example, a for loop can access an array’s elements using the counter variable as the lookup index in functions such as array.get(). However, programmers must ensure the counter always represents a valid index to prevent out-of-bounds errors. Additionally, if an array might be empty, programmers must set conditions to prevent the loop’s execution entirely.
The code below shows a for loop whose counter boundaries depend on the number of elements in an array. If the array is empty, containing zero elements, the header’s final counter value is na, which prevents iteration. Otherwise, the final value is one less than the array’s size (i.e., the index of the last element):
In contrast, a for…in loop automatically validates an array’s size and directly accesses its elements, providing a more convenient solution than a traditional for loop. The line below achieves the same effect as the code above without requiring the programmer to define boundaries explicitly or use the array.get() function to access each element:
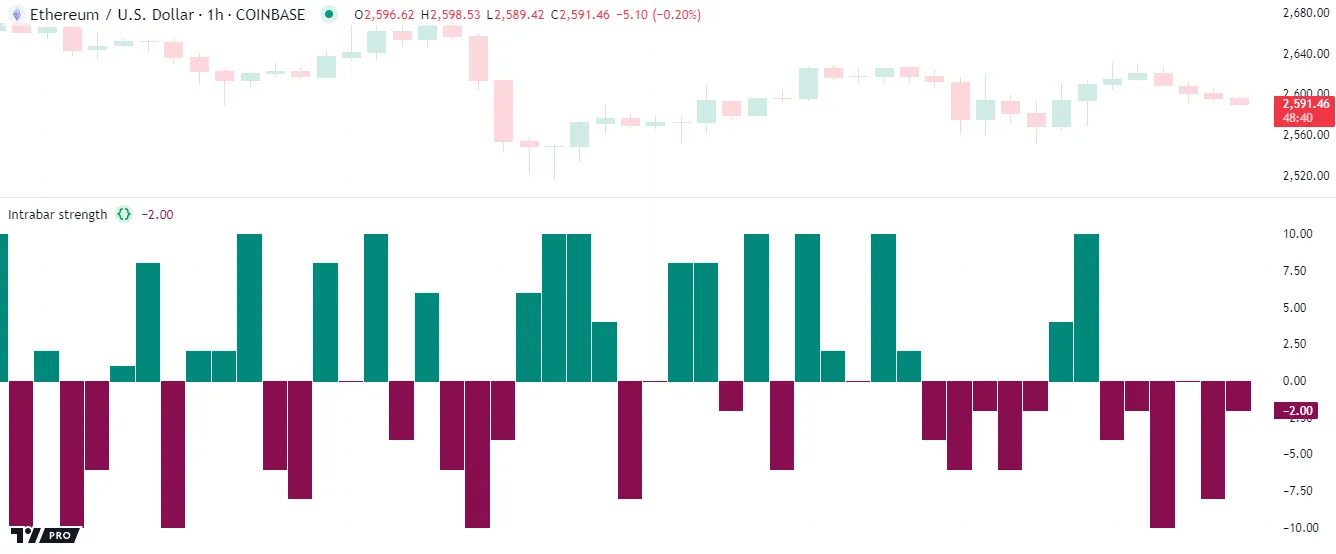
The following example examines bars on a lower timeframe to gauge the strength of intrabar trends within each chart bar. The script uses a request.security_lower_tf() call to retrieve an array of intrabar hl2 prices from a calculated lowerTimeframe. Then, it uses a for…in loop to access each price within the intrabarPrices array and compare the value to the current close to calculate the bar’s strength. The script plots the strength as columns in a separate pane:
The second form of the for…in loop is a convenient solution when a script’s calculations require accessing each element and corresponding index within an array:
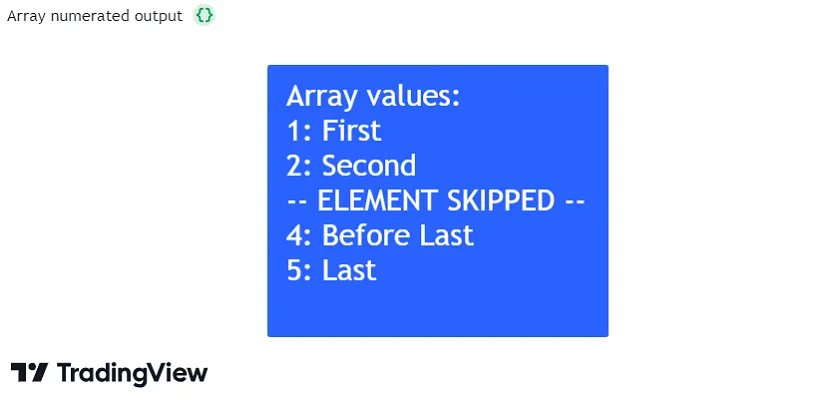
For example, suppose we want to display a numerated list of array elements within a label while excluding values at specific indices. We can use the second form of the for…in loop structure to accomplish this task. The simple script below declares a stringArray variable that references an array of predefined “string” values. On the last historical bar, the script uses a for…in loop to access each index and element in the stringArray to construct the labelText, which it uses in a label.new() call after the loop ends:
Note that:
- This example adds 1 to the
indexin the str.tostring() call to start the numerated list with a value of"1", because array indices always begins at 0. - On the third loop iteration, when
index == 2, the script adds an"-- ELEMENT SKIPPED --"message to thelabelTextinstead of the retrievedelementand uses thecontinuekeyword to skip the remainder of the iteration. See this section above to learn more about loop keywords.
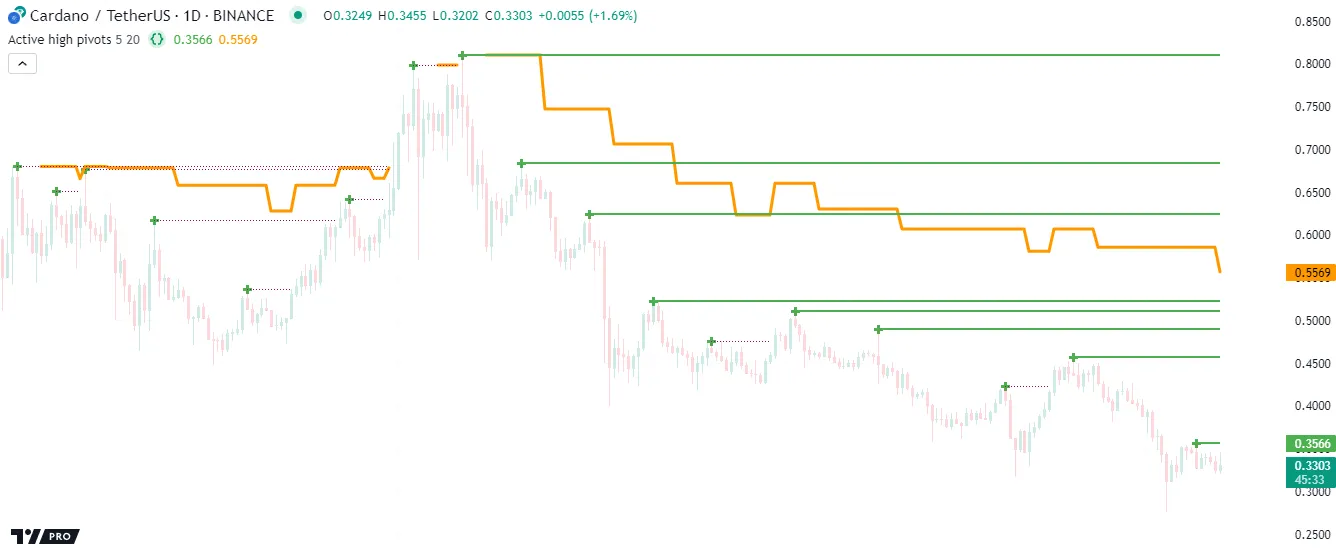
Let’s explore an advanced example demonstrating the utility of for…in loops. The following indicator draws a fixed number of horizontal lines at pivot high values calculated from a ta.pivothigh() call, and it analyzes the lines within a loop to determine which ones represent active (uncrossed) pivots.
Each time the script detects a new pivot high point, it creates a new line, inserts that line at the beginning of the pivotLines array, then removes the oldest element and deletes its ID using line.delete(). The script accesses each line within the array using a for…in loop, analyzing and modifying the properties of the line referenced on each iteration. When the current high crosses above the pivotLine, the script changes its style to signify that it is no longer an active level. Otherwise, it extends the line’s x2 coordinate and uses its price to calculate the average active pivot value. The script also plots each pivot high value and the average active pivot value on the chart:
Note that:
- The loop in this example executes on every bar because it has to compare active pivot line prices with the current high value, then use the remaining active prices to calculate the bar’s
avgActivePivotvalue. - Pine Script features several ways to calculate averages, many of which do not require a loop. However, a loop is necessary in this example because the script uses information only available on the current bar to determine which prices contribute toward the average.
- The first form of the for…in loop is the most convenient option in this example because we need direct access to the lines referenced within the
pivotLinesarray, but we do not need the corresponding index values.
Looping through matrices
Pine scripts can iterate over the contents of a matrix in several different ways. Unlike arrays, matrices use two indices to reference their elements because they store data in a rectangular format. The first index refers to rows, and the second refers to columns. If a programmer opts to use for or while loops to iterate through matrices instead of using for…in, they must carefully define the loop boundaries or conditions to avoid out-of-bounds errors.
This code block shows a for loop that performs row-wise iteration, looping through each row index in a matrix and using the value in a matrix.row() call to retrieve a row array. If the matrix is empty, the loop statement uses a final loop counter value of na to prevent iteration. Otherwise, the final counter is the last row index, which is one less than the value returned by matrix.rows():
Note that:
- If we replace the matrix.rows() and matrix.row() calls with matrix.columns() and matrix.col(), the loop performs column-wise iteration instead.
The for…in loop statement is the more convenient approach to loop over and access the rows of a matrix in order, as it automatically validates the number of rows and retrieves an array of the current row’s elements on each iteration:
When a script’s calculations require access to each row from a matrix and its corresponding index, programmers can use the second form of the for…in loop:
Note that:
- The for…in loop only performs row-wise iteration on matrices. To emulate column-wise iteration, programmers can use a for…in loop on a transposed copy.
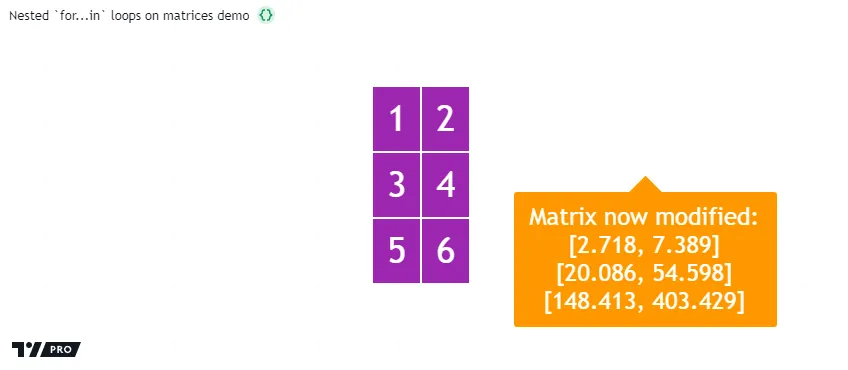
The following example creates a custom string representing the rows of a matrix with extra information. When the script executes on the last historical bar, it creates a 3x3 matrix populated with values from math.random() calls. Using the first form of the for…in loop, the script iterates through each row in the matrix to create a “string” value representing the row’s contents, its average, and whether the average is above 0.5. Before the end of each iteration, the script concatenates the constructed string with the labelText value. After the loop ends, the script creates a label to display the labelText variable’s final value:

Working with matrices often entails iteratively accessing their elements, not just their rows and columns, typically using nested loops. For example, this code block uses an outer for loop to iterate over row indices. The inner for loop iterates over column indices on each outer loop iteration and calls matrix.get() to access an element:
Alternatively, a more convenient approach for this type of task is to use nested for…in loops. The outer for…in loop in this code block retrieves each row array in a matrix, and the inner for…in statement loops through that array:
The script below creates a 3x2 matrix, then accesses and modifies its elements within nested for…in loops. Both loops use the second form of the for…in statement to retrieve index values and corresponding items. The outer loop accesses a row index and row array from the matrix. The inner loop accesses each index and respective element from that array.
Within the nested loop’s iterations, the script converts each element to a “string” and initializes a table cell at the rowIndex row and colIndex column. Then, it uses the loop header variables within matrix.set() to update the matrix element. After the outer loop terminates, the script displays a “string” representation of the updated matrix within a label:
Looping through maps
The for…in loop statement is the primary, most convenient approach for iterating over the data within Pine Script maps.
Unlike arrays and matrices, maps are unordered collections that store data in key-value pairs. Rather than traversing an internal lookup index, a script references the keys from the pairs within a map to access its values. Therefore, when looping through a map, scripts must perform pair-wise iteration, which entails retrieving key-value pairs across iterations rather than indexed elements or rows.
Note that:
- Although maps are unordered collections, Pine Script internally tracks the insertion order of their key-value pairs.
One way to access the data from a map is to use the map.keys() function, which returns an array containing all the keys from the map, sorted in their insertion order. A script can use the for…in structure to loop through the array of keys and call map.get() to retrieve corresponding values:
However, the more convenient, recommended approach is to loop through a map directly without creating new arrays. To loop through a map directly, use the second form of the for…in loop statement. Using this loop with a map creates a tuple containing a key and respective value on each iteration. As when looping through a map.keys() array, this direct for…in loop iterates through a map’s contents in their insertion order:
Note that:
- The second form of the for…in loop is the only way to iterate directly through a map. A script cannot directly loop through this collection type without retrieving a key and value on each iteration.
Let’s consider a simple example demonstrating how a for…in loop works on a map. When the script below executes on the last historical bar, it declares a simpleMap variable to reference a map of “string” keys and “float” values. The script uses map.put() to insert the keys from the newKeys array into the collection with corresponding values from math.random() calls. Then, it uses a for…in loop to iterate through the key-value pairs from the map and construct the displayText string. After the loop ends, the script uses a label to visualize the string:
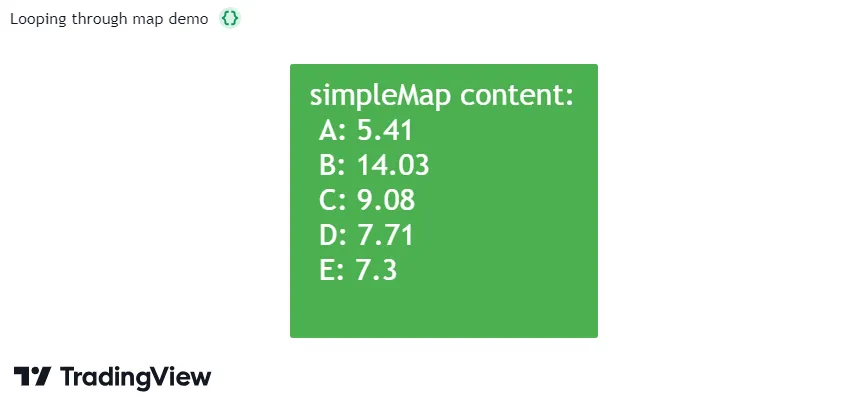
Note that:
- This script uses both forms of the for…in loop statement. The first loop iterates through the “string” elements of the
newKeysarray to put key-value pairs into the map referenced bysimpleMap, and the second iterates directly through the map’s key-value pairs to construct the custom string.