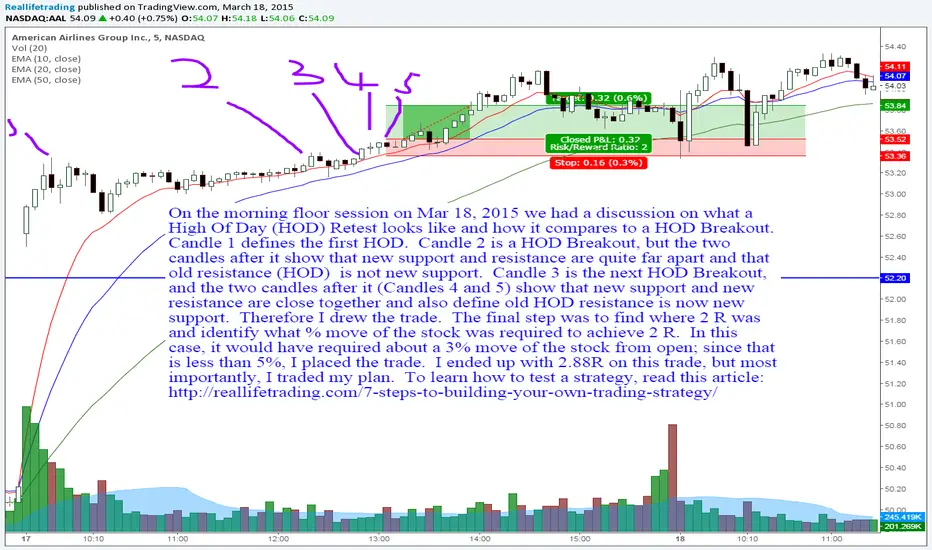
On the morning floor session on Mar 18, 2015 we had a discussion on what a High Of Day (HOD) Retest looks like and how it compares to a HOD Breakout. Candle 1 defines the first HOD. Candle 2 is a HOD Breakout, but the two candles after it show that new support and resistance are quite far apart and that old resistance (HOD) is not new support. Candle 3 is the next HOD Breakout, and the two candles after it (Candles 4 and 5) show that new support and new resistance are close together and also define old HOD resistance is now new support. Therefore I drew the trade. The final step was to find where 2 R was and identify what % move of the stock was required to achieve 2 R. In this case, it would have required about a 3% move of the stock from open; since that is less than 5%, I placed the trade. I ended up with 2.88R on this trade, but most importantly, I traded my plan. To learn how to test a strategy, read this article: reallifetrading.com/7-steps-to-building-your-own-trading-strategy/
Penafian
Maklumat dan penerbitan adalah tidak dimaksudkan untuk menjadi, dan tidak membentuk, nasihat untuk kewangan, pelaburan, perdagangan dan jenis-jenis lain atau cadangan yang dibekalkan atau disahkan oleh TradingView. Baca dengan lebih lanjut di Terma Penggunaan.
Penafian
Maklumat dan penerbitan adalah tidak dimaksudkan untuk menjadi, dan tidak membentuk, nasihat untuk kewangan, pelaburan, perdagangan dan jenis-jenis lain atau cadangan yang dibekalkan atau disahkan oleh TradingView. Baca dengan lebih lanjut di Terma Penggunaan.