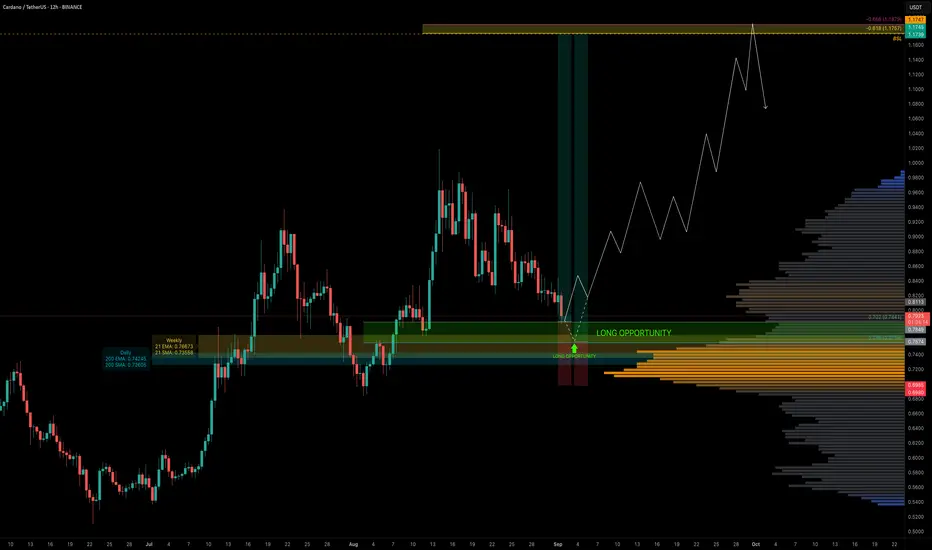
ADA has been in a downtrend for the past 18 days and is now approaching a cluster of key support levels. Today, price tapped the 0.702 Fib retracement ($0.7841) — an optimal area for long entries.
The main focus, however, is the 0.786 Fib retracement, which aligns with a liquidity pocket and multiple layers of confluence, making it the most ideal entry zone.
🧩 Confluence at 0.702–0.786 Fib Zone
🟢 Long Trade Setup
Technical Insight
🔍 Indicators used
➡️ Available for free. You can find it on my profile under “Scripts” and apply it directly to your charts for extra confluence when planning your trades.
_________________________________
💬 If you found this helpful, drop a like and comment!
The main focus, however, is the 0.786 Fib retracement, which aligns with a liquidity pocket and multiple layers of confluence, making it the most ideal entry zone.
🧩 Confluence at 0.702–0.786 Fib Zone
- 0.702–0.786 Fib retracement → prime long entry range
- Liquidity pocket → sitting around the 0.786 Fib
- 200 EM ($0.7424) / 200 SMA ($0.726) (daily)
- 21 EMA ($0.766) / 21 SMA ($0.735) (weekly)
- Pitchfork lower support line → intersecting the zone
- 0.618/0.666 Fib Speed Fan → adding another support layer
🟢 Long Trade Setup
- Entry Zone: 0.702–0.786 Fib retracement
- Best Entry: Around the 0.786 Fib
- Stop-Loss: Below $0.70 (to be adjusted after seeing more price action)
- Target (TP): $1.1757 (–0.618 Fib, in confluence with key high & buy-side liquidity at $1.1747)
- Potential Move: +50%
- R:R: ~1:4.5 up to 1:7 (depending on entry)
Technical Insight
- ADA is testing deeper retracements within its current downtrend, the 0.702–0.786 Fib zone combines structural, dynamic, and liquidity-based confluence.
- The added support of the weekly 21 EMA/SMA strengthens this area as a pivotal level for bulls to defend.
- If held, this zone could fuel a swing long setup with great upside potential.
- The $1.1747–$1.1757 zone is both a high-confluence take-profit area and a potential short opportunity, given the liquidity resting above that level.
🔍 Indicators used
- LuxAlgo — Liquidity Sentiment Profile (Auto-Anchored)
- Multi Timeframe 8x MA Support Resistance Zones [SiDec] → to identify support and resistance zones such as the weekly 21 EMA/SMA
➡️ Available for free. You can find it on my profile under “Scripts” and apply it directly to your charts for extra confluence when planning your trades.
_________________________________
💬 If you found this helpful, drop a like and comment!
Nota
0.702 Fib +3% Bounce:Nota
Long opportunity ahead:Dagangan ditutup secara manual
Closed manually after seeing heavy sellingNota
POC of the 1 year trading range sits around $0.74, worth keeping in mind.0.702 Fib Speed Fan Support Line + 21 Weekly TF EMA/SMA Key Reversal Zone:
ADA is sitting at the range lows, an area where long setups become attractive. This is a key reversal point I’d like to see hold.
Nota
High-probability long setup is around $0.72 where the 1.0 trend-based fib extension aligns with the 0.886 retracement and the 0.618 retracement of the full move:🏆 Mastering Fibonacci for precision trading
🔹 Sharing high-probability trade setups
⚡ Unlock the power of technical analysis!
🔹 Sharing high-probability trade setups
⚡ Unlock the power of technical analysis!
Penerbitan berkaitan
Penafian
Maklumat dan penerbitan adalah tidak dimaksudkan untuk menjadi, dan tidak membentuk, nasihat untuk kewangan, pelaburan, perdagangan dan jenis-jenis lain atau cadangan yang dibekalkan atau disahkan oleh TradingView. Baca dengan lebih lanjut di Terma Penggunaan.
🏆 Mastering Fibonacci for precision trading
🔹 Sharing high-probability trade setups
⚡ Unlock the power of technical analysis!
🔹 Sharing high-probability trade setups
⚡ Unlock the power of technical analysis!
Penerbitan berkaitan
Penafian
Maklumat dan penerbitan adalah tidak dimaksudkan untuk menjadi, dan tidak membentuk, nasihat untuk kewangan, pelaburan, perdagangan dan jenis-jenis lain atau cadangan yang dibekalkan atau disahkan oleh TradingView. Baca dengan lebih lanjut di Terma Penggunaan.