Sydney Sweeney controversy or not, American Eagle Outfitters  AEO has struggled for some 18 months now and is even trading lower than it did on a split-adjusted basis in October 1999. What does the clothing retailer's fundamental and technical analysis say as AEO prepares to release second-quarter results?
American Eagle Outfitters' Fundamental Analysis
AEO has lost more than half of its value between Friday's close at $12.94 and the stock's March 2024 $26.44 intraday peak.
That said, the recent controversy over the clothing firm's jeans ad featuring actress Sydney Sweeney has helped breathe some life into the stock over the past six weeks or so.
AEO has risen 39.6% since its June 13 52-week low as social-media users -- including President Donald Trump -- weighed in on whether its "Sydney Sweeney Has Good Jeans" ad campaign was bigoted.
Still, the firm will release fiscal Q2 results after the bell on Wednesday at a time when quarterly numbers haven't generally been kind to AEO.
The retailer posted a fiscal Q1 loss in May and has seen year-over-year earnings and revenues both contract for three consecutive three-month periods.
Nonetheless, analysts expect AEO to report a return to profitability in this week's earnings. The consensus view calls for $0.20 in adjusted earnings per share on $1.23 billion of revenue.
However, that would compare poorly to the $0.30 in adjusted EPS that American Eagle Outfitters reported in the year-ago period, while also reflecting 4.4% in year-over-year sales contraction.
Of the nine sell-side analysts that I found that cover this name, seven have lowered their earnings estimates for the quarter since it began, although two have revised their numbers higher.
But interestingly, two highly rated analysts have expressed completely different opinions of the stock just a week ahead of its earnings release.
Jay Sole of UBS reiterated his "Buy" rating and $19 price target vs. AEO's aforementioned $12.94 Friday close.
Conversely, Christopher Nardone of Bank of America downgraded the stock to "Underperform" from a previous "Neutral" while taking his target price down to $10 from an earlier $11. (TipRanks rates both Cole and Nardone at four-stars-plus out of a possible five.)
American Eagle Outfitters' Technical Analysis
Next, let's look at AEO's chart going back six months:

This chart shows competing technical set-ups that appear to be sending mixed messages ahead of the AEO's earnings release.
On one hand, readers will see that from last spring into this past summer, AEO developed what's called a "double-bottom" pattern of bullish reversal, marked with black diagonal lines and showing a $13 neckline (pivot). The stock broke through this pivot in early August, but didn't get very far.
That said, a much smaller "double-top" pattern of bearish reversal might have since developed with a $12 downside pivot, as shown by the pink-shaded areas at the chart's right.
I say "might" because we really don't know yet if that second top is really a top. Although we might have a downside pivot, it wouldn't take much for the stock to resume its reaction to the earlier bullish double-top set-up that appeared to run out of gas.
Meanwhile, AEO's Relative Strength Index (the gray line at the chart's top) is looking better than neutral technically, but really is nothing special.
However, the stock's daily Moving Average Convergence Divergence indicator (or "MACD," marked black and gold lines and blue bars at the chart's bottom) appears bearish, but is also showing some signs of life.
The histogram of the 9-day Exponential Moving Average (or "EMA," denoted by the blue bars) is in negative territory, but not significantly so.
And both the 12-day EMA (black line) and 26-day EMA (gold line) are in positive territory, which could be bullish. Nonetheless, the gold line is above the black line, which is usually a bearish technical signal.
Add it all up and investors and traders will have to choose. Which sell-side analyst has it right? Which technical set-up has it right?
The bullish set-up looks better defined right now, but this will probably be decided by AEO itself when the company goes public this week with its quarterly numbers.
(Moomoo Technologies Inc. Markets Commentator Stephen “Sarge” Guilfoyle had no position in AEO at the time of writing this column.)
This article discusses technical analysis, other approaches, including fundamental analysis, may offer very different views. The examples provided are for illustrative purposes only and are not intended to be reflective of the results you can expect to achieve. Specific security charts used are for illustrative purposes only and are not a recommendation, offer to sell, or a solicitation of an offer to buy any security. Past investment performance does not indicate or guarantee future success. Returns will vary, and all investments carry risks, including loss of principal. This content is also not a research report and is not intended to serve as the basis for any investment decision. The information contained in this article does not purport to be a complete description of the securities, markets, or developments referred to in this material. Moomoo and its affiliates make no representation or warranty as to the article's adequacy, completeness, accuracy or timeliness for any particular purpose of the above content. Furthermore, there is no guarantee that any statements, estimates, price targets, opinions or forecasts provided herein will prove to be correct.
The Analyst Ratings feature comes from TipRanks, an independent third party. The accuracy, completeness, or reliability cannot be guaranteed and should not be relied upon as a primary basis for any investment decision. The target prices are intended for informational purposes only, not recommendations, and are also not guarantees of future results.
Moomoo is a financial information and trading app offered by Moomoo Technologies Inc. In the U.S., investment products and services on Moomoo are offered by Moomoo Financial Inc., Member FINRA/SIPC.
TradingView is an independent third party not affiliated with Moomoo Financial Inc., Moomoo Technologies Inc., or its affiliates. Moomoo Financial Inc. and its affiliates do not endorse, represent or warrant the completeness and accuracy of the data and information available on the TradingView platform and are not responsible for any services provided by the third-party platform.
American Eagle Outfitters' Fundamental Analysis
AEO has lost more than half of its value between Friday's close at $12.94 and the stock's March 2024 $26.44 intraday peak.
That said, the recent controversy over the clothing firm's jeans ad featuring actress Sydney Sweeney has helped breathe some life into the stock over the past six weeks or so.
AEO has risen 39.6% since its June 13 52-week low as social-media users -- including President Donald Trump -- weighed in on whether its "Sydney Sweeney Has Good Jeans" ad campaign was bigoted.
Still, the firm will release fiscal Q2 results after the bell on Wednesday at a time when quarterly numbers haven't generally been kind to AEO.
The retailer posted a fiscal Q1 loss in May and has seen year-over-year earnings and revenues both contract for three consecutive three-month periods.
Nonetheless, analysts expect AEO to report a return to profitability in this week's earnings. The consensus view calls for $0.20 in adjusted earnings per share on $1.23 billion of revenue.
However, that would compare poorly to the $0.30 in adjusted EPS that American Eagle Outfitters reported in the year-ago period, while also reflecting 4.4% in year-over-year sales contraction.
Of the nine sell-side analysts that I found that cover this name, seven have lowered their earnings estimates for the quarter since it began, although two have revised their numbers higher.
But interestingly, two highly rated analysts have expressed completely different opinions of the stock just a week ahead of its earnings release.
Jay Sole of UBS reiterated his "Buy" rating and $19 price target vs. AEO's aforementioned $12.94 Friday close.
Conversely, Christopher Nardone of Bank of America downgraded the stock to "Underperform" from a previous "Neutral" while taking his target price down to $10 from an earlier $11. (TipRanks rates both Cole and Nardone at four-stars-plus out of a possible five.)
American Eagle Outfitters' Technical Analysis
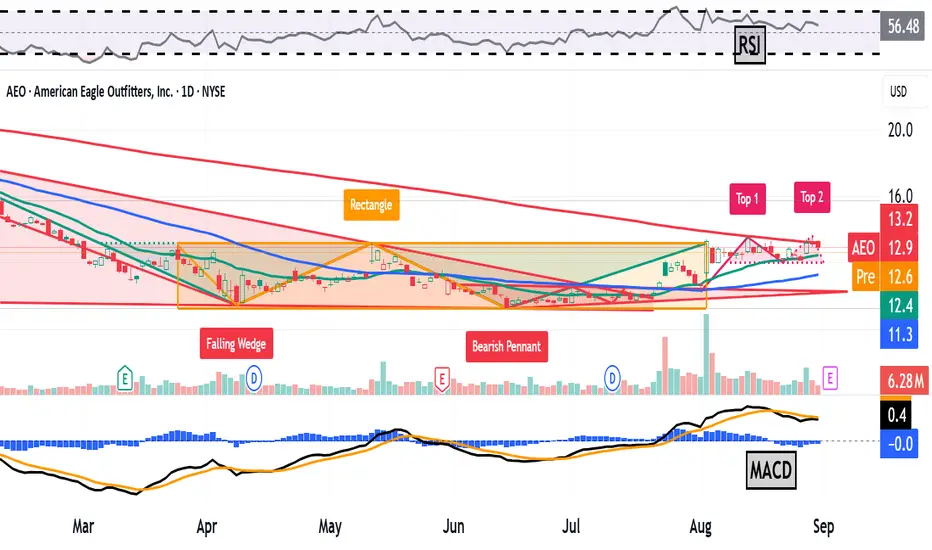
Next, let's look at AEO's chart going back six months:
This chart shows competing technical set-ups that appear to be sending mixed messages ahead of the AEO's earnings release.
On one hand, readers will see that from last spring into this past summer, AEO developed what's called a "double-bottom" pattern of bullish reversal, marked with black diagonal lines and showing a $13 neckline (pivot). The stock broke through this pivot in early August, but didn't get very far.
That said, a much smaller "double-top" pattern of bearish reversal might have since developed with a $12 downside pivot, as shown by the pink-shaded areas at the chart's right.
I say "might" because we really don't know yet if that second top is really a top. Although we might have a downside pivot, it wouldn't take much for the stock to resume its reaction to the earlier bullish double-top set-up that appeared to run out of gas.
Meanwhile, AEO's Relative Strength Index (the gray line at the chart's top) is looking better than neutral technically, but really is nothing special.
However, the stock's daily Moving Average Convergence Divergence indicator (or "MACD," marked black and gold lines and blue bars at the chart's bottom) appears bearish, but is also showing some signs of life.
The histogram of the 9-day Exponential Moving Average (or "EMA," denoted by the blue bars) is in negative territory, but not significantly so.
And both the 12-day EMA (black line) and 26-day EMA (gold line) are in positive territory, which could be bullish. Nonetheless, the gold line is above the black line, which is usually a bearish technical signal.
Add it all up and investors and traders will have to choose. Which sell-side analyst has it right? Which technical set-up has it right?
The bullish set-up looks better defined right now, but this will probably be decided by AEO itself when the company goes public this week with its quarterly numbers.
(Moomoo Technologies Inc. Markets Commentator Stephen “Sarge” Guilfoyle had no position in AEO at the time of writing this column.)
This article discusses technical analysis, other approaches, including fundamental analysis, may offer very different views. The examples provided are for illustrative purposes only and are not intended to be reflective of the results you can expect to achieve. Specific security charts used are for illustrative purposes only and are not a recommendation, offer to sell, or a solicitation of an offer to buy any security. Past investment performance does not indicate or guarantee future success. Returns will vary, and all investments carry risks, including loss of principal. This content is also not a research report and is not intended to serve as the basis for any investment decision. The information contained in this article does not purport to be a complete description of the securities, markets, or developments referred to in this material. Moomoo and its affiliates make no representation or warranty as to the article's adequacy, completeness, accuracy or timeliness for any particular purpose of the above content. Furthermore, there is no guarantee that any statements, estimates, price targets, opinions or forecasts provided herein will prove to be correct.
The Analyst Ratings feature comes from TipRanks, an independent third party. The accuracy, completeness, or reliability cannot be guaranteed and should not be relied upon as a primary basis for any investment decision. The target prices are intended for informational purposes only, not recommendations, and are also not guarantees of future results.
Moomoo is a financial information and trading app offered by Moomoo Technologies Inc. In the U.S., investment products and services on Moomoo are offered by Moomoo Financial Inc., Member FINRA/SIPC.
TradingView is an independent third party not affiliated with Moomoo Financial Inc., Moomoo Technologies Inc., or its affiliates. Moomoo Financial Inc. and its affiliates do not endorse, represent or warrant the completeness and accuracy of the data and information available on the TradingView platform and are not responsible for any services provided by the third-party platform.
Penafian
The information and publications are not meant to be, and do not constitute, financial, investment, trading, or other types of advice or recommendations supplied or endorsed by TradingView. Read more in the Terms of Use.
Penafian
The information and publications are not meant to be, and do not constitute, financial, investment, trading, or other types of advice or recommendations supplied or endorsed by TradingView. Read more in the Terms of Use.