Expect break out of consolidation.
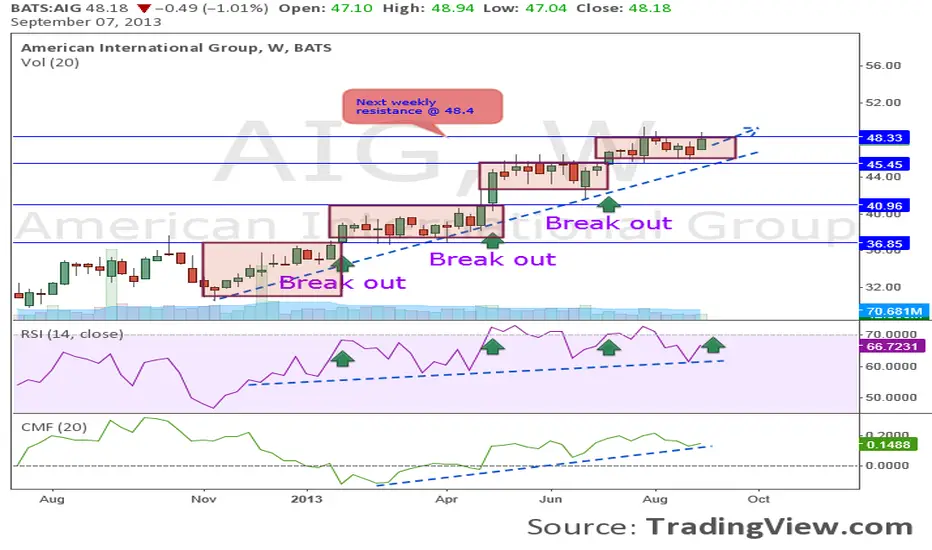
Looking at the weekly AIG chart, AIG has been moving up as blocks (purple boxes) of consolidation zones. Each box usually last between 9-13 weeks long, and has a well defined support and resistant levels. Each break out is usually accompanied by a peak in RSI (usually break above 70). Overall there is still positive money flow into the stock (as shown by positive CMF 20).
Taking everything together, I expect AIG to continue this bullish trend. Looking at RSI, I expect another break out shortly (next coming week or so), as RSI is approaching 70.
Penafian
Maklumat dan penerbitan adalah tidak dimaksudkan untuk menjadi, dan tidak membentuk, nasihat untuk kewangan, pelaburan, perdagangan dan jenis-jenis lain atau cadangan yang dibekalkan atau disahkan oleh TradingView. Baca dengan lebih lanjut di Terma Penggunaan.
Penafian
Maklumat dan penerbitan adalah tidak dimaksudkan untuk menjadi, dan tidak membentuk, nasihat untuk kewangan, pelaburan, perdagangan dan jenis-jenis lain atau cadangan yang dibekalkan atau disahkan oleh TradingView. Baca dengan lebih lanjut di Terma Penggunaan.