--
### 📊 **Technical Analysis Summary:**
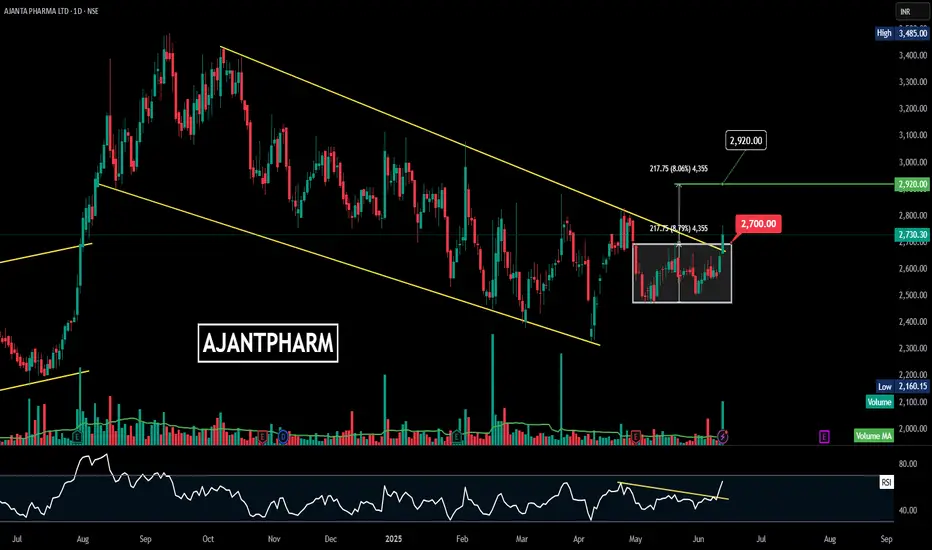
#### 🔹 **Chart Pattern:**
* **Falling Channel** (Yellow trendlines): Price has been respecting a downward-sloping channel since mid-2023.
* Recently, the price **broke out above the upper trendline**, indicating a **potential trend reversal**.
#### 🔹 **Consolidation Zone:**
* There was a **rectangle consolidation** (boxed region) between ₹2,480 and ₹2,700.
* The breakout above ₹2,700 confirms bullish intent and may act as a new support.
#### 🔹 **Breakout Target:**
* The measured move from the box is **approx. ₹217.75**.
* Adding to the breakout level gives a projected **target of ₹2,920**.
#### 🔹 **Volume:**
* **Volume spike** on breakout day = strong confirmation of the breakout.
#### 🔹 **RSI (Relative Strength Index):**
* RSI broke out of its own **downtrend resistance**.
* Now trading above 60 = bullish momentum building up.
---
### 🎯 **Levels to Watch:**
| Type | Price (₹) |
| ----------------------- | ----------- |
| **Breakout Point** | 2,700 |
| **Current Price** | 2,730 |
| **Target** | 2,920 |
| **Support Zone** | 2,480–2,700 |
| **Volume Confirmation** | Yes ✅ |
---
### ✅ **Conclusion:**
Ajanta Pharma is showing strong bullish signs:
* Breakout from falling channel
* Volume-backed move
* RSI confirmation
**As long as the price holds above ₹2,700**, the upside towards ₹2,920 remains intact.
### 📊 **Technical Analysis Summary:**
#### 🔹 **Chart Pattern:**
* **Falling Channel** (Yellow trendlines): Price has been respecting a downward-sloping channel since mid-2023.
* Recently, the price **broke out above the upper trendline**, indicating a **potential trend reversal**.
#### 🔹 **Consolidation Zone:**
* There was a **rectangle consolidation** (boxed region) between ₹2,480 and ₹2,700.
* The breakout above ₹2,700 confirms bullish intent and may act as a new support.
#### 🔹 **Breakout Target:**
* The measured move from the box is **approx. ₹217.75**.
* Adding to the breakout level gives a projected **target of ₹2,920**.
#### 🔹 **Volume:**
* **Volume spike** on breakout day = strong confirmation of the breakout.
#### 🔹 **RSI (Relative Strength Index):**
* RSI broke out of its own **downtrend resistance**.
* Now trading above 60 = bullish momentum building up.
---
### 🎯 **Levels to Watch:**
| Type | Price (₹) |
| ----------------------- | ----------- |
| **Breakout Point** | 2,700 |
| **Current Price** | 2,730 |
| **Target** | 2,920 |
| **Support Zone** | 2,480–2,700 |
| **Volume Confirmation** | Yes ✅ |
---
### ✅ **Conclusion:**
Ajanta Pharma is showing strong bullish signs:
* Breakout from falling channel
* Volume-backed move
* RSI confirmation
**As long as the price holds above ₹2,700**, the upside towards ₹2,920 remains intact.
Penafian
Maklumat dan penerbitan adalah tidak dimaksudkan untuk menjadi, dan tidak membentuk, nasihat untuk kewangan, pelaburan, perdagangan dan jenis-jenis lain atau cadangan yang dibekalkan atau disahkan oleh TradingView. Baca dengan lebih lanjut di Terma Penggunaan.
Penafian
Maklumat dan penerbitan adalah tidak dimaksudkan untuk menjadi, dan tidak membentuk, nasihat untuk kewangan, pelaburan, perdagangan dan jenis-jenis lain atau cadangan yang dibekalkan atau disahkan oleh TradingView. Baca dengan lebih lanjut di Terma Penggunaan.