Advanced Micro Devices  AMD has been on a roll recently, rising more than 100% in less than four months after losing nearly 60% of its value between a February 2024 intraday peak and an April 2025 session low. What does technical and fundamental analysis say as the chip giant prepares to report Q2 earnings on Tuesday?
Let's take a look:
AMD's Fundamental Analysis
AMD has risen amid several seemingly positive recent catalysts.
First, the Trump administration eased as part of the recent Washington-Beijing temporary trade truce some restrictions on advanced-chip sales to China by AMD and Nvidia.
Published reports also speculate that AMD might raise prices on its Instinct MI350 AI accelerator chips to $25,000 from an earlier $15,000 estimate. The Instinct MI350 is supposedly a realistic rival to Nvidia's high-end Blackwell B200 chips.
Wells Fargo analyst Aaron Rakers (who gets a five-star rating out of a possible five by TipRanks) also recently speculated that AMD will be able to charge around $30,000 for its next generation MI355X chip.
Rakers has a "Buy" rating on AMD and a $185 target price vs. Friday's $171.70 close. (Full disclosure: I am also long AMD.)
The chip giant will release Q2 results after the bell Tuesday, with the Street looking for $0.48 in adjusted earnings per share on about $7.4 billion of revenue.
At first blush, that doesn't compare well to the $0.69 in adjusted EPS that AMD reported in Q2 2024. But investors should understand that the firm is exporting more freely to China again, while demand for its newer products is pushing both prices and AMD's operating margin higher.
Note as well that the $7.4 billion revenue print that analysts expect for the company's latest quarter would represent more than 27% year-over-year growth.
That said, 27 of the 39 sell-side analysts that I can find who follow AMD have revised their earnings estimates lower since the quarter began. Just five have increased their estimates, while seven have left things unchanged.
AMD's Technical Analysis
Next, let's look at AMD's chart going back some six months and running through Thursday afternoon:

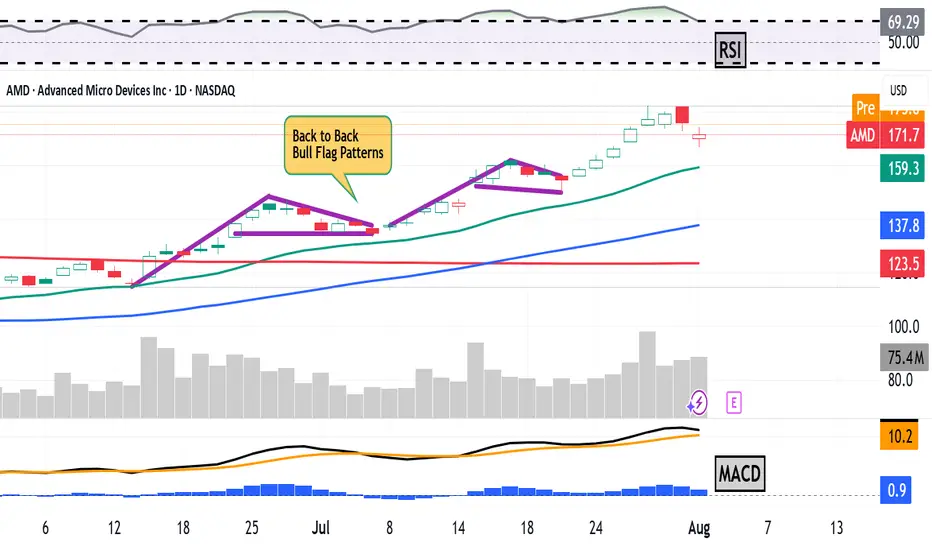
Readers will see that AMD blasted out of what's called an "inverted head-and-shoulders pattern" of bullish reversal in early June with a $127 pivot (marked with jagged line and red-orange shading in the chart above).
Since then, the stock has developed two consecutive "bull-flag" patterns at the chart's right. These are historically what's known as "patterns of continuance," meaning that after a short consolidation period, a stock continues with its trend -- re-energized by the pause.
The bull-flag patterns put AMD's current upside pivot at $162, suggesting that perhaps as the stock approaches earnings, it could have more in the tank.
Of course, that might depend on how CEO Lisa Su handles this week's earnings call and what kind of forward guidance the firm issues.
Meanwhile, AMD's Relative Strength Index (the gray line at the chart's top) is more than robust. In fact, it's technically overbought and has been for most of July.
Similarly, AMD's daily Moving Average Convergence Divergence indicator (or "MACD," marked with black and gold lines and blue bars at the chart's bottom) is extremely bullish-looking.
The histogram of the stock's 9-day Exponential Moving Average (or "EMA," denoted with blue bars) is well above zero and has been since early July. That's historically bullish.
The 12-day EMA (marked with black line) is also well above AMD's 26-day EMA (the gold line), with both of them above zero. Again, that's a technically bullish sign.
(Moomoo Technologies Inc. Markets Commentator Stephen “Sarge” Guilfoyle was long AMD at the time of writing this column.)
This article discusses technical analysis, other approaches, including fundamental analysis, may offer very different views. The examples provided are for illustrative purposes only and are not intended to be reflective of the results you can expect to achieve. Specific security charts used are for illustrative purposes only and are not a recommendation, offer to sell, or a solicitation of an offer to buy any security. Past investment performance does not indicate or guarantee future success. Returns will vary, and all investments carry risks, including loss of principal. This content is also not a research report and is not intended to serve as the basis for any investment decision. The information contained in this article does not purport to be a complete description of the securities, markets, or developments referred to in this material. Moomoo and its affiliates make no representation or warranty as to the article's adequacy, completeness, accuracy or timeliness for any particular purpose of the above content. Furthermore, there is no guarantee that any statements, estimates, price targets, opinions or forecasts provided herein will prove to be correct.
The Analyst Ratings feature comes from TipRanks, an independent third party. The accuracy, completeness, or reliability cannot be guaranteed and should not be relied upon as a primary basis for any investment decision. The target prices are intended for informational purposes only, not recommendations, and are also not guarantees of future results. show less
Moomoo is a financial information and trading app offered by Moomoo Technologies Inc. In the U.S., investment products and services on Moomoo are offered by Moomoo Financial Inc., Member FINRA/SIPC.
TradingView is an independent third party not affiliated with Moomoo Financial Inc., Moomoo Technologies Inc., or its affiliates. Moomoo Financial Inc. and its affiliates do not endorse, represent or warrant the completeness and accuracy of the data and information available on the TradingView platform and are not responsible for any services provided by the third-party platform.
Let's take a look:
AMD's Fundamental Analysis
AMD has risen amid several seemingly positive recent catalysts.
First, the Trump administration eased as part of the recent Washington-Beijing temporary trade truce some restrictions on advanced-chip sales to China by AMD and Nvidia.
Published reports also speculate that AMD might raise prices on its Instinct MI350 AI accelerator chips to $25,000 from an earlier $15,000 estimate. The Instinct MI350 is supposedly a realistic rival to Nvidia's high-end Blackwell B200 chips.
Wells Fargo analyst Aaron Rakers (who gets a five-star rating out of a possible five by TipRanks) also recently speculated that AMD will be able to charge around $30,000 for its next generation MI355X chip.
Rakers has a "Buy" rating on AMD and a $185 target price vs. Friday's $171.70 close. (Full disclosure: I am also long AMD.)
The chip giant will release Q2 results after the bell Tuesday, with the Street looking for $0.48 in adjusted earnings per share on about $7.4 billion of revenue.
At first blush, that doesn't compare well to the $0.69 in adjusted EPS that AMD reported in Q2 2024. But investors should understand that the firm is exporting more freely to China again, while demand for its newer products is pushing both prices and AMD's operating margin higher.
Note as well that the $7.4 billion revenue print that analysts expect for the company's latest quarter would represent more than 27% year-over-year growth.
That said, 27 of the 39 sell-side analysts that I can find who follow AMD have revised their earnings estimates lower since the quarter began. Just five have increased their estimates, while seven have left things unchanged.
AMD's Technical Analysis
Next, let's look at AMD's chart going back some six months and running through Thursday afternoon:
Readers will see that AMD blasted out of what's called an "inverted head-and-shoulders pattern" of bullish reversal in early June with a $127 pivot (marked with jagged line and red-orange shading in the chart above).
Since then, the stock has developed two consecutive "bull-flag" patterns at the chart's right. These are historically what's known as "patterns of continuance," meaning that after a short consolidation period, a stock continues with its trend -- re-energized by the pause.
The bull-flag patterns put AMD's current upside pivot at $162, suggesting that perhaps as the stock approaches earnings, it could have more in the tank.
Of course, that might depend on how CEO Lisa Su handles this week's earnings call and what kind of forward guidance the firm issues.
Meanwhile, AMD's Relative Strength Index (the gray line at the chart's top) is more than robust. In fact, it's technically overbought and has been for most of July.
Similarly, AMD's daily Moving Average Convergence Divergence indicator (or "MACD," marked with black and gold lines and blue bars at the chart's bottom) is extremely bullish-looking.
The histogram of the stock's 9-day Exponential Moving Average (or "EMA," denoted with blue bars) is well above zero and has been since early July. That's historically bullish.
The 12-day EMA (marked with black line) is also well above AMD's 26-day EMA (the gold line), with both of them above zero. Again, that's a technically bullish sign.
(Moomoo Technologies Inc. Markets Commentator Stephen “Sarge” Guilfoyle was long AMD at the time of writing this column.)
This article discusses technical analysis, other approaches, including fundamental analysis, may offer very different views. The examples provided are for illustrative purposes only and are not intended to be reflective of the results you can expect to achieve. Specific security charts used are for illustrative purposes only and are not a recommendation, offer to sell, or a solicitation of an offer to buy any security. Past investment performance does not indicate or guarantee future success. Returns will vary, and all investments carry risks, including loss of principal. This content is also not a research report and is not intended to serve as the basis for any investment decision. The information contained in this article does not purport to be a complete description of the securities, markets, or developments referred to in this material. Moomoo and its affiliates make no representation or warranty as to the article's adequacy, completeness, accuracy or timeliness for any particular purpose of the above content. Furthermore, there is no guarantee that any statements, estimates, price targets, opinions or forecasts provided herein will prove to be correct.
The Analyst Ratings feature comes from TipRanks, an independent third party. The accuracy, completeness, or reliability cannot be guaranteed and should not be relied upon as a primary basis for any investment decision. The target prices are intended for informational purposes only, not recommendations, and are also not guarantees of future results. show less
Moomoo is a financial information and trading app offered by Moomoo Technologies Inc. In the U.S., investment products and services on Moomoo are offered by Moomoo Financial Inc., Member FINRA/SIPC.
TradingView is an independent third party not affiliated with Moomoo Financial Inc., Moomoo Technologies Inc., or its affiliates. Moomoo Financial Inc. and its affiliates do not endorse, represent or warrant the completeness and accuracy of the data and information available on the TradingView platform and are not responsible for any services provided by the third-party platform.
Penafian
Maklumat dan penerbitan adalah tidak dimaksudkan untuk menjadi, dan tidak membentuk, nasihat untuk kewangan, pelaburan, perdagangan dan jenis-jenis lain atau cadangan yang dibekalkan atau disahkan oleh TradingView. Baca dengan lebih lanjut di Terma Penggunaan.
Penafian
Maklumat dan penerbitan adalah tidak dimaksudkan untuk menjadi, dan tidak membentuk, nasihat untuk kewangan, pelaburan, perdagangan dan jenis-jenis lain atau cadangan yang dibekalkan atau disahkan oleh TradingView. Baca dengan lebih lanjut di Terma Penggunaan.