🚀 Amazon (AMZN) – Multi-Timeframe Technical Setup
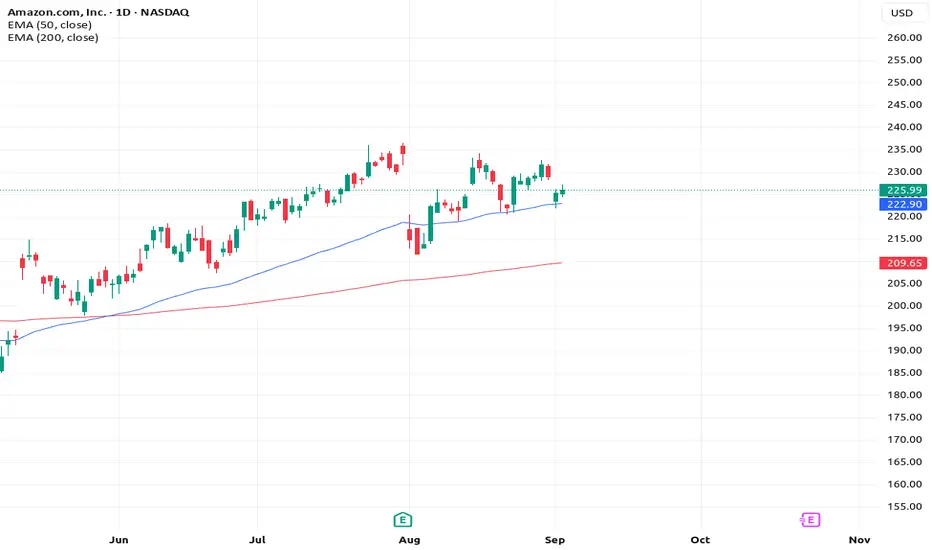
Daily Chart:
On the daily chart, the technical summary shows a neutral rating. Both the oscillators and moving averages are neutral. Digging deeper, the MACD is signaling a sell, hinting at short-term hesitation.
Weekly Chart:
Shifting to the weekly chart, the oscillator rating also appears neutral initially. However, examining momentum reveals a pullback forming—the exact setup we want to spot for a potential continuation. Bingo!
Monthly Chart:
On the monthly chart, the long-term picture is bullish. Moving averages show a strong buy, with price comfortably above the 50 EMA and 200 EMA. Add in a gap up, and Amazon looks ready for a potential upward surge.
🚀 Rocket Booster Strategy – 3 Steps
Look for neutral technical summary or short-term sell signals like MACD to identify hesitation in the short-term trend.
Examine weekly momentum indicators to find pullbacks—this is where you prepare for a continuation in the trend.
Check moving averages (50 EMA & 200 EMA). Price above these with gap-ups signals strong long-term bullish alignment—the “rocket booster” for your trade.
This combination of short-term caution, medium-term pullback, and long-term strength is the essence of the Rocket Booster Strategy.
Rocket Boost This Content To Learn More.
⚠️ Disclaimer
This article is for educational purposes only. Always use a simulation (paper) trading account to test strategies before trading live. Apply proper risk management and profit-taking strategies to protect capital.
Daily Chart:
On the daily chart, the technical summary shows a neutral rating. Both the oscillators and moving averages are neutral. Digging deeper, the MACD is signaling a sell, hinting at short-term hesitation.
Weekly Chart:
Shifting to the weekly chart, the oscillator rating also appears neutral initially. However, examining momentum reveals a pullback forming—the exact setup we want to spot for a potential continuation. Bingo!
Monthly Chart:
On the monthly chart, the long-term picture is bullish. Moving averages show a strong buy, with price comfortably above the 50 EMA and 200 EMA. Add in a gap up, and Amazon looks ready for a potential upward surge.
🚀 Rocket Booster Strategy – 3 Steps
- Daily Chart – Spot Neutral or Short-Term Weakness:
Look for neutral technical summary or short-term sell signals like MACD to identify hesitation in the short-term trend.
- Weekly Chart – Identify Momentum Pullback:
Examine weekly momentum indicators to find pullbacks—this is where you prepare for a continuation in the trend.
- Monthly Chart – Confirm Long-Term Strength:
Check moving averages (50 EMA & 200 EMA). Price above these with gap-ups signals strong long-term bullish alignment—the “rocket booster” for your trade.
This combination of short-term caution, medium-term pullback, and long-term strength is the essence of the Rocket Booster Strategy.
Rocket Boost This Content To Learn More.
⚠️ Disclaimer
This article is for educational purposes only. Always use a simulation (paper) trading account to test strategies before trading live. Apply proper risk management and profit-taking strategies to protect capital.
Penerbitan berkaitan
Penafian
The information and publications are not meant to be, and do not constitute, financial, investment, trading, or other types of advice or recommendations supplied or endorsed by TradingView. Read more in the Terms of Use.
Penerbitan berkaitan
Penafian
The information and publications are not meant to be, and do not constitute, financial, investment, trading, or other types of advice or recommendations supplied or endorsed by TradingView. Read more in the Terms of Use.