AASTER 1H Technical Analysis
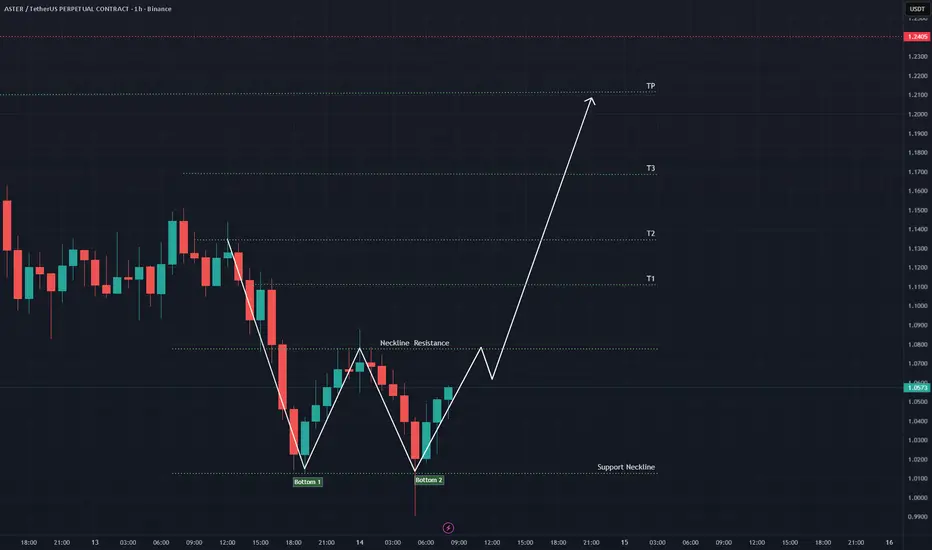
ASTER is forming a clean Double Bottom structure on the 1H chart, signaling potential bullish reversal after a strong downside move.
Price has printed two clear lows (Bottom 1 & Bottom 2), holding the same support level — showing buyers stepping in aggressively.
The key level now is the Neckline Resistance.
A breakout and close above the neckline would confirm the reversal and open the path toward higher targets.
T1: $1.11
T2: $1.14
T3: $1.17
Main TP: $1.21+
Bullish Bias:
Valid only if price breaks and holds above the neckline.
Until then, it remains a potential reversal, not a confirmed trend shift.
Invalidation:
A close below Bottom 2 would invalidate the double-bottom setup and resume bearish momentum.
Overall, the structure looks promising, but confirmation is required before considering long positions.
#ASTER #YodaXCalls #TechnicalAnalysis #DoubleBottom #TradingView
Dagangan ditutup: sasaran tercapai
Target reached +21%Penafian
Maklumat dan penerbitan adalah tidak bertujuan, dan tidak membentuk, nasihat atau cadangan kewangan, pelaburan, dagangan atau jenis lain yang diberikan atau disahkan oleh TradingView. Baca lebih dalam Terma Penggunaan.
Penafian
Maklumat dan penerbitan adalah tidak bertujuan, dan tidak membentuk, nasihat atau cadangan kewangan, pelaburan, dagangan atau jenis lain yang diberikan atau disahkan oleh TradingView. Baca lebih dalam Terma Penggunaan.