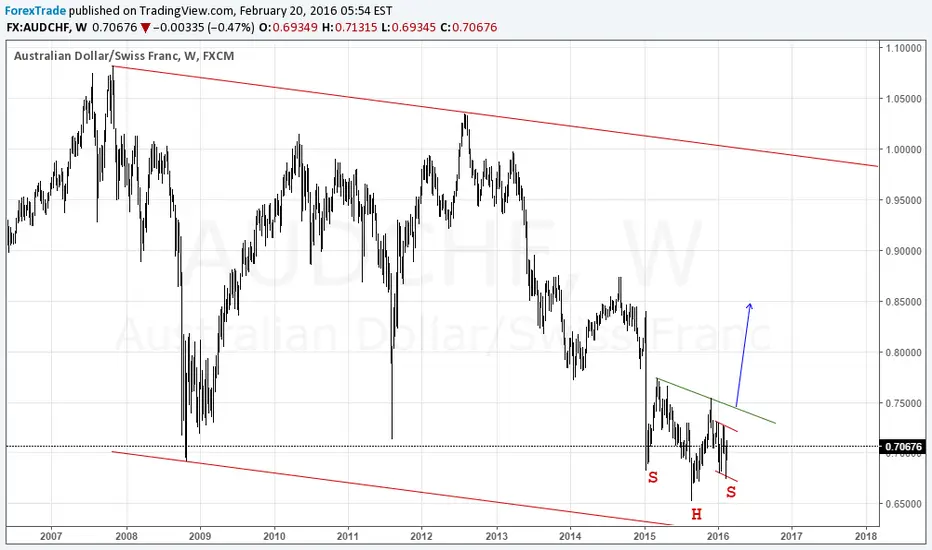
AudChf has an interesting chart and it can be H&S reversal pattern. Technical analysis gives plenty of space for imagination and until pattern is not finished, I can not say that is definitely H&S pattern. Just using support and resistance lines I have different picture: 
Basically is just a weekly Flag pattern inside consolidation and on the short term it has to be traded as range. If I take a look at 4 hour chart :
I can see, that in the middle of the weekly Flag 4 hour chart had a small consolidation, broke down, later came test ex-support, dropped down and currently came back to test ex-support again.
Until weekly Flag remains I am going to trade just long positions, but at the moment there are no entries for long positions: selling is a better option for now. Positiveness will come if price will manage to get inside consolidation of the 4 hour chart. Just when I will be looking for long entries. For now just watching.
Penafian
Maklumat dan penerbitan adalah tidak dimaksudkan untuk menjadi, dan tidak membentuk, nasihat untuk kewangan, pelaburan, perdagangan dan jenis-jenis lain atau cadangan yang dibekalkan atau disahkan oleh TradingView. Baca dengan lebih lanjut di Terma Penggunaan.
Penafian
Maklumat dan penerbitan adalah tidak dimaksudkan untuk menjadi, dan tidak membentuk, nasihat untuk kewangan, pelaburan, perdagangan dan jenis-jenis lain atau cadangan yang dibekalkan atau disahkan oleh TradingView. Baca dengan lebih lanjut di Terma Penggunaan.