Hello traders .
Did you remember my last idea about the AXS ? in that idea I was talked a big move for the AXS , am I still think that the AXS is about to do something explosive or not ?
If you want to read my last idea , you can find it in the related ideas down below this idea 👇
1_pattern :

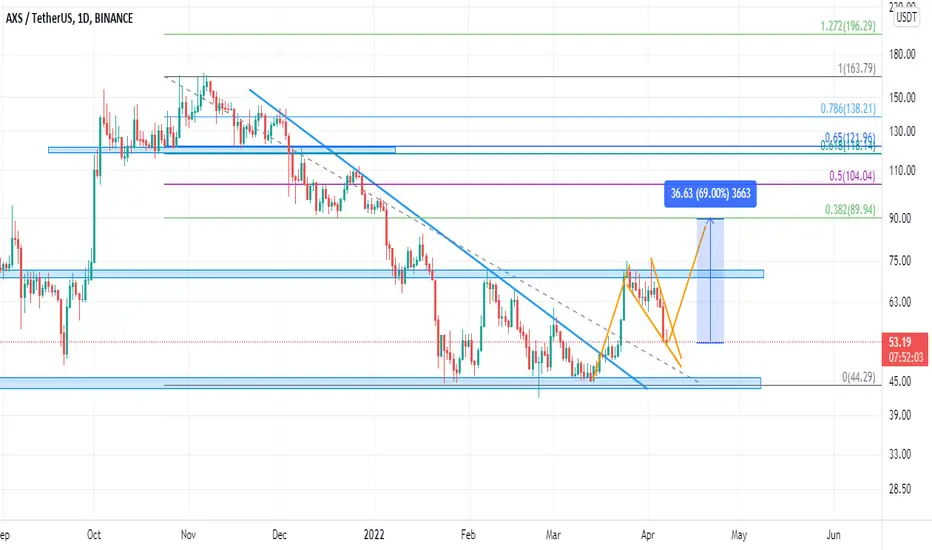
In the chart above you can see that the price after testing the daily resistance structure started to retracement and currently price is in the falling wedge pattern which is a bullish pattern and when you see this pattern in a bullish trend you like what we have in the above picture you could call that as a flag pattern .
2_EMA Ribbon :

you can see that after price break above the the EMA Ribbon , it started to flipping bullish but after price hitting the the daily resistance , price started to retracement and break below the EMA Ribbon again , but still there is chance to goes above the EMA Ribbon again because the overall trend is still bullish in the daily time frame and AXS price didn't create a lower low .
3_TSI & RSI :

In the RSI we had a bearish divergence in the smaller time frame which is also obvious in the daily chart and this was a sign for the short term trend reversal , so by knowing that , you could take some profit from your long position or maybe open a short position after getting the confirmation of that .
In the TSI you can see that the it started to flip bearish but it still above the zero line so I personally don't consider it as a bearish sign .
4_ price target :

If price decided to break above the falling wedge or in the other word , flag pattern , the technical target of it , is near to the 0.382 Fibonacci level .
This is not a Financial advice and always trade based on your trading strategy ; have nice day my dear friends .
Did you remember my last idea about the AXS ? in that idea I was talked a big move for the AXS , am I still think that the AXS is about to do something explosive or not ?
If you want to read my last idea , you can find it in the related ideas down below this idea 👇
1_pattern :
In the chart above you can see that the price after testing the daily resistance structure started to retracement and currently price is in the falling wedge pattern which is a bullish pattern and when you see this pattern in a bullish trend you like what we have in the above picture you could call that as a flag pattern .
2_EMA Ribbon :
you can see that after price break above the the EMA Ribbon , it started to flipping bullish but after price hitting the the daily resistance , price started to retracement and break below the EMA Ribbon again , but still there is chance to goes above the EMA Ribbon again because the overall trend is still bullish in the daily time frame and AXS price didn't create a lower low .
3_TSI & RSI :
In the RSI we had a bearish divergence in the smaller time frame which is also obvious in the daily chart and this was a sign for the short term trend reversal , so by knowing that , you could take some profit from your long position or maybe open a short position after getting the confirmation of that .
In the TSI you can see that the it started to flip bearish but it still above the zero line so I personally don't consider it as a bearish sign .
4_ price target :
If price decided to break above the falling wedge or in the other word , flag pattern , the technical target of it , is near to the 0.382 Fibonacci level .
This is not a Financial advice and always trade based on your trading strategy ; have nice day my dear friends .
_____________________________________
🐺 Discipline is rarely enjoyable ,
But almost always profitable 🐺
TElEGRAM CHANNEL : t.me/KIU_COIN
_____________________________________
🐺 Discipline is rarely enjoyable ,
But almost always profitable 🐺
TElEGRAM CHANNEL : t.me/KIU_COIN
_____________________________________
Penerbitan berkaitan
Penafian
Maklumat dan penerbitan adalah tidak dimaksudkan untuk menjadi, dan tidak membentuk, nasihat untuk kewangan, pelaburan, perdagangan dan jenis-jenis lain atau cadangan yang dibekalkan atau disahkan oleh TradingView. Baca dengan lebih lanjut di Terma Penggunaan.
_____________________________________
🐺 Discipline is rarely enjoyable ,
But almost always profitable 🐺
TElEGRAM CHANNEL : t.me/KIU_COIN
_____________________________________
🐺 Discipline is rarely enjoyable ,
But almost always profitable 🐺
TElEGRAM CHANNEL : t.me/KIU_COIN
_____________________________________
Penerbitan berkaitan
Penafian
Maklumat dan penerbitan adalah tidak dimaksudkan untuk menjadi, dan tidak membentuk, nasihat untuk kewangan, pelaburan, perdagangan dan jenis-jenis lain atau cadangan yang dibekalkan atau disahkan oleh TradingView. Baca dengan lebih lanjut di Terma Penggunaan.