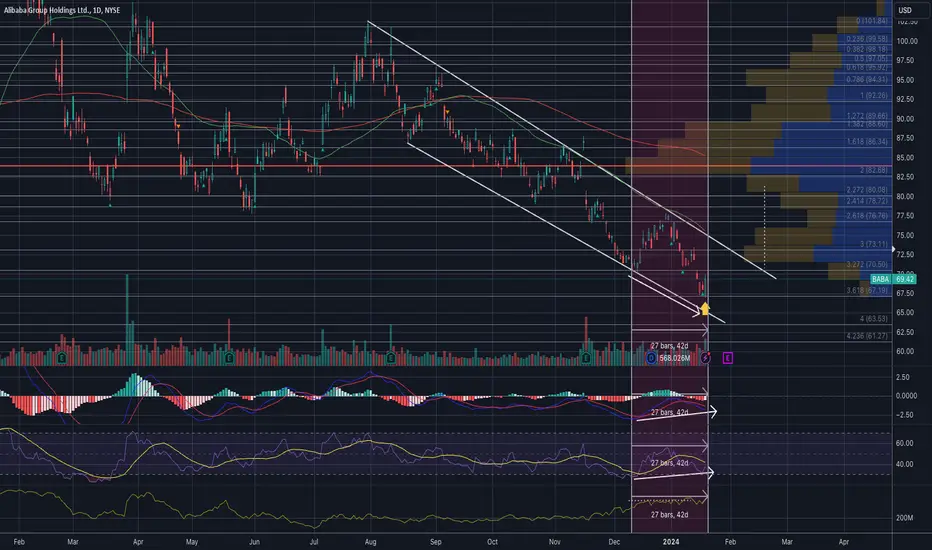
The Accumulation Distribution, MACD, and RSI all show bullish divergence, meaning accumulation is happening underneath while the price declined.
The weekly candle also printed a hammer candle, which means if the price can close above $70.50, it can see further gains.
Here are my upside targets:
$73
$76
$80
$85
Downside Risk:
$63
I post detailed technical analysis of stocks with targets. If you find my analysis helpful, please don't forget to give me a follow.
I am not a licensed professional. None of the posts that I published are investment advice. Do your own research.
Penafian
Maklumat dan penerbitan adalah tidak bertujuan, dan tidak membentuk, nasihat atau cadangan kewangan, pelaburan, dagangan atau jenis lain yang diberikan atau disahkan oleh TradingView. Baca lebih dalam Terma Penggunaan.