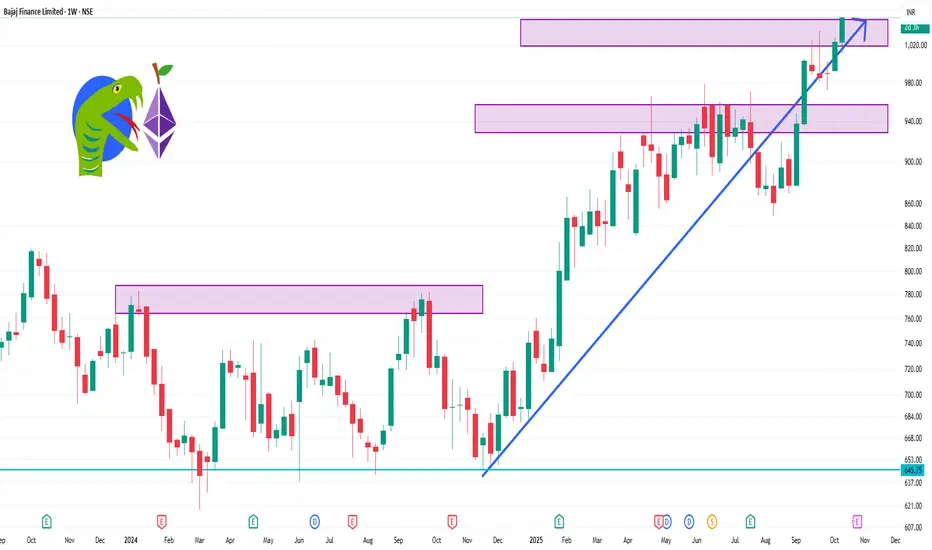
📈 Weekly Technical Levels
Resistance Levels: ₹1,036.75 (short-term), ₹1,023.85 (mid-term)
Support Levels: ₹1,009.85 (short-term), ₹938 (mid-term), ₹816.86 (long-term)
These levels suggest that the stock is trading above its key support zones, indicating a potential continuation of the uptrend.
🔧 Key Technical Indicators
RSI (14): 66.57 — approaching overbought territory, but still room for upward movement.
MACD: 20.92 — indicates bullish momentum.
ADX (14): 31.50 — suggests a strong trend.
Supertrend: ₹973.61 — currently bullish.
Parabolic SAR: ₹982.79 — supports the bullish trend.
Stochastic Oscillator: 84.34 — near overbought levels, indicating potential for a pullback.
Commodity Channel Index (CCI): +131.56 — suggests the stock is overbought.
These indicators collectively point towards a strong bullish trend, though caution is advised as some indicators approach overbought conditions.
Penerbitan berkaitan
Penafian
Maklumat dan penerbitan adalah tidak bertujuan, dan tidak membentuk, nasihat atau cadangan kewangan, pelaburan, dagangan atau jenis lain yang diberikan atau disahkan oleh TradingView. Baca lebih dalam Terma Penggunaan.
Penerbitan berkaitan
Penafian
Maklumat dan penerbitan adalah tidak bertujuan, dan tidak membentuk, nasihat atau cadangan kewangan, pelaburan, dagangan atau jenis lain yang diberikan atau disahkan oleh TradingView. Baca lebih dalam Terma Penggunaan.