1. Pattern Analysis
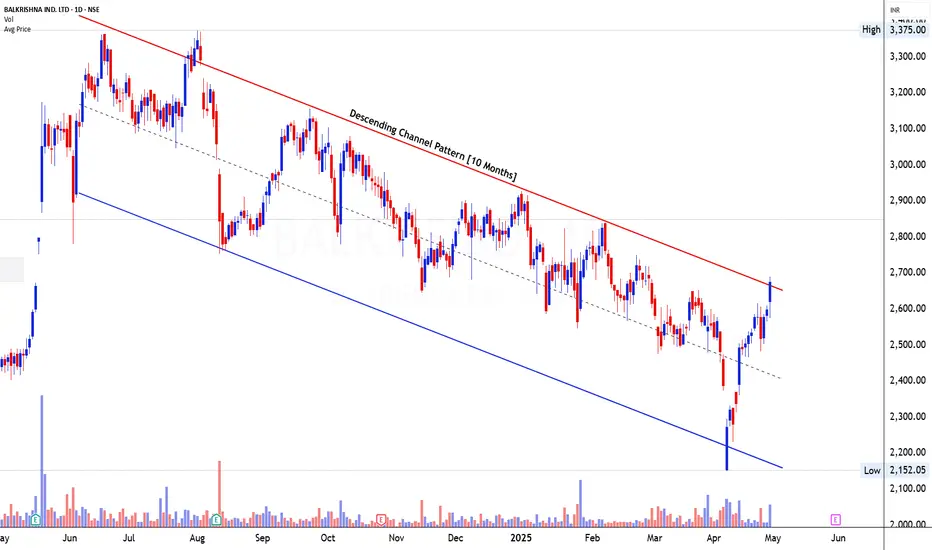
The price structure has developed a Descending Channel Pattern over a span of 10 months, making it a tradable and valid setup as per Mr. Chartist's methodology. The pattern is defined by a sequence of lower highs and lower lows, bounded by clearly marked red resistance and blue support trendlines. The price is currently hovering very close to the upper resistance of this descending channel, indicating an attempt at a breakout. Given that descending channels are typically considered bullish reversal formations when price action breaches the upper trendline, this chart now sits at a critical juncture.
2. Volume Analysis
The volume dynamics offer strong evidence of accumulation, particularly in the recent phase where the price surged from the lower end of the channel toward resistance. There has been a notable increase in volume during the most recent upswing, especially as the price approached the upper trendline. This suggests the presence of institutional buying or smart money entering the stock at lower levels. The previous downswings were characterized by muted volume, while the upswings are supported with rising participation — a classic bullish divergence in volume behavior.
3. Candlestick Analysis
Recent price action has been marked by bullish candles with expanding bodies and strong closes near the day’s highs. This aggressive price movement toward the channel resistance, backed by rising volume, reinforces the bullish undertone. In particular, the bullish momentum off the lower support (around ₹2,150) to the current level suggests a shift in sentiment from supply dominance to demand. However, the current candle sitting just at the resistance line is crucial — a strong breakout with a wide-range candle closing above ₹2,700 would confirm a pattern breakout and trend reversal.
4. Validation of Signal
The bullish setup is nearly validated but not fully confirmed yet. The descending channel pattern’s resistance has been tested but not conclusively broken. The stock is showing strength as it challenges this upper boundary with both price action and volume signaling intent. If the price can sustain above the channel with follow-up buying pressure, it would mark a valid breakout. Until then, the breakout anticipation remains strong but requires confirmation on a closing basis. The risk/reward remains favorable, given the proximity to breakout level and supportive buying volumes.
5. Tradable Points Determination
Entry Point Determination
A clean and confirmed entry will be on a breakout above ₹2,700 with strong bullish follow-through. Traders may also consider a pre-breakout entry between ₹2,660–₹2,690 with a tight stop, expecting a breakout in the next few sessions.
Target Point Determination
Based on the height of the descending channel (roughly ₹600), the measured move target after breakout would project toward ₹3,250–₹3,300, aligning well with previous consolidation zones from early 2024.
Stop Loss Placement and Trailing SL Follow-Up
For initial risk control, a stop loss can be placed below the most recent swing low at ₹2,500. Upon breakout confirmation, this can be trailed to the breakout zone (around ₹2,700). As the stock moves past ₹2,900, further trailing can be done using higher swing lows on the daily chart to lock in gains while allowing trend continuity.
Learn Today for Better Tomorrow
Penafian
Maklumat dan penerbitan adalah tidak dimaksudkan untuk menjadi, dan tidak membentuk, nasihat untuk kewangan, pelaburan, perdagangan dan jenis-jenis lain atau cadangan yang dibekalkan atau disahkan oleh TradingView. Baca dengan lebih lanjut di Terma Penggunaan.