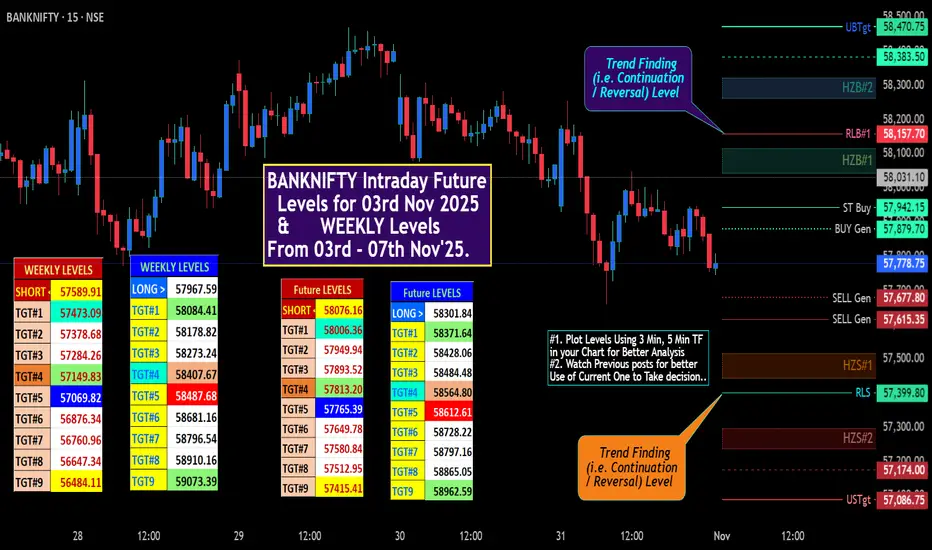
✍🏼️ "Future IntraSwing Levels" mentioned in BOX format.
✍🏼️ "WEEKLY Levels" mentioned in BOX format.
🌡️Plot Levels Using 3 Min, 5 Min Time frame in your Chart for Better Analysis
L#1: If the candle crossed & stays above the “Buy Gen”, it is treated / considered as Bullish bias.
L#2: Possibility / Probability of REVERSAL near RLB#1 & UBTgt
L#3: If the candle stays above “Sell Gen” but below “Buy Gen”, it is treated / considered as Sidewise. Aggressive Traders can take Long position near “Sell Gen” either retesting or crossed from Below & vice-versa i.e. can take Short position near “Buy Gen” either retesting or crossed downward from Above.
L#4: If the candle crossed & stays below the “Sell Gen”, it is treated / considered a Bearish bias.
L#5: Possibility / Probability of REVERSAL near RLS#1 & USTgt
HZB (Buy side) & HZS (Sell side) => Hurdle Zone,
*** Specialty of “HZB#1, HZB#2 HZS#1 & HZS#2” is Sidewise (behaviour in Nature)
Rest Plotted and Mentioned on Chart
Color code Used:
Green =. Positive bias.
Red =. Negative bias.
RED in Between Green means Trend Finder / Momentum Change
/ CYCLE Change and Vice Versa.
Notice One thing: HOW LEVELS are Working.
Use any Momentum Indicator / Oscillatoror as you "USED to" to Take entry.
⚠️ DISCLAIMER:
The information, views, and ideas shared here are purely for educational and informational purposes only. They are not intended as investment advice or a recommendation to buy, sell, or hold any financial instruments. I am not a SEBI-registered financial adviser.
Trading and investing in the stock market involves risk, and you should do your own research and analysis. You are solely responsible for any decisions made based on this research.
"As HARD EARNED MONEY IS YOUR's, So DECISION SHOULD HAVE TO BE YOUR's".
Do comment if Helpful.
In depth Analysis will be added later (If time Permits)
Nota
Astrological predictions for Nifty and BankNifty in November 2025 indicate a mixed but generally positive outlook influenced by planetary transits and astrological phenomena. Several sources noted a bullish trend expectation in early November 2025, with the financial sector likely to experience rapid expansion. Stocks in banking, IT, and auto sectors were expected to show good performance during this period due to favorable Venus and Mercury influences. There is also mention of minor dips associated with planetary retrogrades but overall bullish momentum resuming after brief pauses.Specifically:
Early November 2025 is predicted to be bullish with significant movements expected in BankNifty and Nifty.
Venus in Scorpio and Mercury's transit create opportunities for gains in financial and technical sectors.
After a small mid-month correction, the bullish trend is expected to return.
Daily astrological forecasting apps and channels provide updated, personalized daily insights and trading tips combining astrology and market data.
Market watchers advise caution with selected stocks and using astrology as a directional guide rather than absolute certainty.
This suggests that astrological forecasts anticipate important volatility with upside potential in BankNifty and Nifty through November 2025, making it a time for selective trading and careful attention to astrological transits affecting market sentiment and sectors like banking and finance most directly.
Penerbitan berkaitan
Penafian
Maklumat dan penerbitan adalah tidak bertujuan, dan tidak membentuk, nasihat atau cadangan kewangan, pelaburan, dagangan atau jenis lain yang diberikan atau disahkan oleh TradingView. Baca lebih dalam Terma Penggunaan.
Penerbitan berkaitan
Penafian
Maklumat dan penerbitan adalah tidak bertujuan, dan tidak membentuk, nasihat atau cadangan kewangan, pelaburan, dagangan atau jenis lain yang diberikan atau disahkan oleh TradingView. Baca lebih dalam Terma Penggunaan.