Hourly Technical Summary (as of August 29, 2025, ~10:00 AM GMT)
Investing.com’s “Nifty Bank (NSEBANK)” technicals on the hourly chart show:
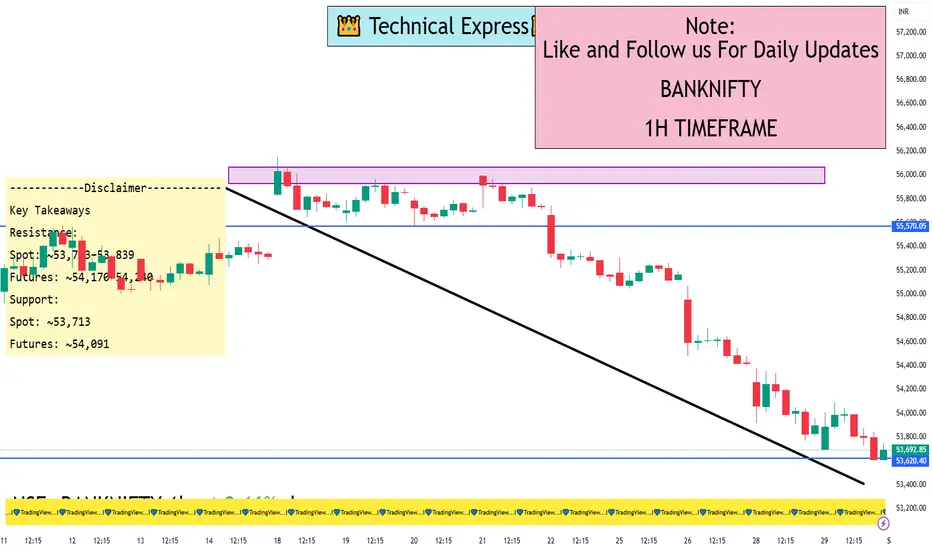
Overall Summary: Strong Sell
Moving Averages: 12 out of 12 (both Simple and Exponential across various periods) suggest Sell
Key Indicators:
RSI (14): ~25 – Sell
Stochastic oscillator: Overbought
MACD: Sell
ADX: Strong Sell (indicating trending weakness)
Other metrics (CCI, ROC, Bull/Bear Power) – mostly Sell
Pivot-levels (Hourly):
Classic:
S1: 53,713
Pivot: 53,783
R1: 53,839
Fibonacci: similar to above
Camarilla: tighter range around 53,783
How to Use This
Short-term traders might look to enter on bounces near the resistance end of the range with tight stop-loss, targeting support.
Breakout traders should watch if support breaks — could see accelerated decline — or if resistance is broken with volume, signaling possible reversal.
Risk management is key given mixed oscillator readings and macro volatility.
Do keep in mind:
These are technical snapshots as of August 29, 2025. If you're looking for real-time or updated levels, regularly check live tools like TradingView, Investing.com, or your trading platform.
Always blend technical levels with broader market context and risk tolerance before taking action.
Investing.com’s “Nifty Bank (NSEBANK)” technicals on the hourly chart show:
Overall Summary: Strong Sell
Moving Averages: 12 out of 12 (both Simple and Exponential across various periods) suggest Sell
Key Indicators:
RSI (14): ~25 – Sell
Stochastic oscillator: Overbought
MACD: Sell
ADX: Strong Sell (indicating trending weakness)
Other metrics (CCI, ROC, Bull/Bear Power) – mostly Sell
Pivot-levels (Hourly):
Classic:
S1: 53,713
Pivot: 53,783
R1: 53,839
Fibonacci: similar to above
Camarilla: tighter range around 53,783
How to Use This
Short-term traders might look to enter on bounces near the resistance end of the range with tight stop-loss, targeting support.
Breakout traders should watch if support breaks — could see accelerated decline — or if resistance is broken with volume, signaling possible reversal.
Risk management is key given mixed oscillator readings and macro volatility.
Do keep in mind:
These are technical snapshots as of August 29, 2025. If you're looking for real-time or updated levels, regularly check live tools like TradingView, Investing.com, or your trading platform.
Always blend technical levels with broader market context and risk tolerance before taking action.
I built a Buy & Sell Signal Indicator with 85% accuracy.
📈 Get access via DM or
WhatsApp: wa.link/d997q0
Contact - +91 76782 40962
| Email: techncialexpress@gmail.com
| Script Coder | Trader | Investor | From India
📈 Get access via DM or
WhatsApp: wa.link/d997q0
Contact - +91 76782 40962
| Email: techncialexpress@gmail.com
| Script Coder | Trader | Investor | From India
Penerbitan berkaitan
Penafian
Maklumat dan penerbitan adalah tidak bertujuan, dan tidak membentuk, nasihat atau cadangan kewangan, pelaburan, dagangan atau jenis lain yang diberikan atau disahkan oleh TradingView. Baca lebih dalam Terma Penggunaan.