📊 BAT/USDT 2D Update
🔎 Technical Observation:
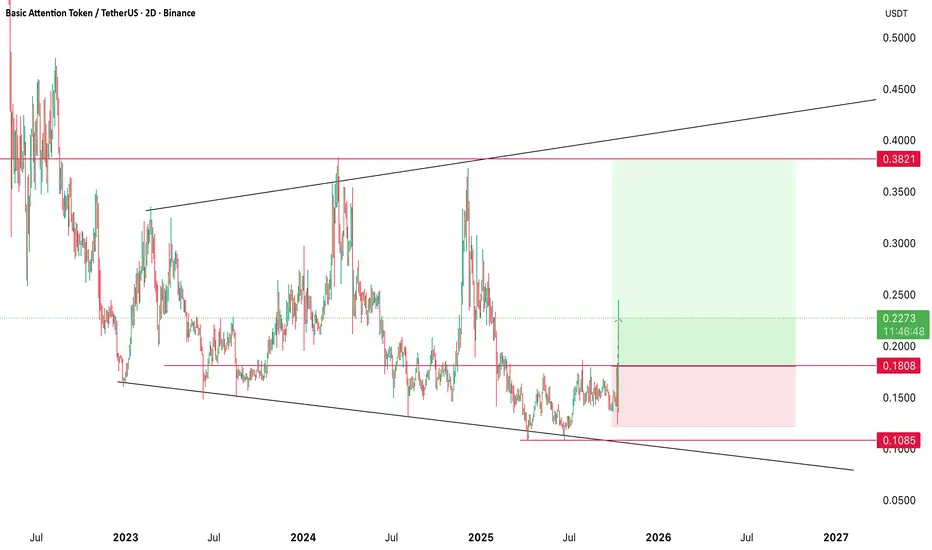
- Price is trading within a large broadening wedge (megaphone) pattern, indicating expanding volatility with higher highs and lower lows.
- The structure shows a recent, strong rejection from the lower trendline support, suggesting buying interest at these levels.
- No indicators are visible on the chart to provide additional confluence.
⚠️ Key Levels:
- Support: ~$0.1804, ~$0.1086 (lower trendline and recent low).
- Resistance: ~$0.3821 (upper trendline of the pattern).
📉 Market Outlook:
- Bullish bias for a move within the pattern. The bounce from the lower boundary is a classic sign of rotation in this type of formation.
- The most probable scenario is a continued push higher to test the upper resistance trendline. A breakdown below the ~$0.1086 low would invalidate this outlook.
💡 Trade Idea
- The analysis of the existing chart reveals a textbook long setup. Following the confirmed bounce off the lower boundary of the megaphone pattern, the price is fundamentally positioned to travel to the upper trendline. The target of ~$0.3821 represents the logical price objective for this rotation.
✅ Closing Note:
Broadening patterns inherently signal increased volatility, so prudent risk management is essential.
🔎 Technical Observation:
- Price is trading within a large broadening wedge (megaphone) pattern, indicating expanding volatility with higher highs and lower lows.
- The structure shows a recent, strong rejection from the lower trendline support, suggesting buying interest at these levels.
- No indicators are visible on the chart to provide additional confluence.
⚠️ Key Levels:
- Support: ~$0.1804, ~$0.1086 (lower trendline and recent low).
- Resistance: ~$0.3821 (upper trendline of the pattern).
📉 Market Outlook:
- Bullish bias for a move within the pattern. The bounce from the lower boundary is a classic sign of rotation in this type of formation.
- The most probable scenario is a continued push higher to test the upper resistance trendline. A breakdown below the ~$0.1086 low would invalidate this outlook.
💡 Trade Idea
- The analysis of the existing chart reveals a textbook long setup. Following the confirmed bounce off the lower boundary of the megaphone pattern, the price is fundamentally positioned to travel to the upper trendline. The target of ~$0.3821 represents the logical price objective for this rotation.
✅ Closing Note:
Broadening patterns inherently signal increased volatility, so prudent risk management is essential.
Penafian
Maklumat dan penerbitan adalah tidak bertujuan, dan tidak membentuk, nasihat atau cadangan kewangan, pelaburan, dagangan atau jenis lain yang diberikan atau disahkan oleh TradingView. Baca lebih dalam Terma Penggunaan.
Penafian
Maklumat dan penerbitan adalah tidak bertujuan, dan tidak membentuk, nasihat atau cadangan kewangan, pelaburan, dagangan atau jenis lain yang diberikan atau disahkan oleh TradingView. Baca lebih dalam Terma Penggunaan.