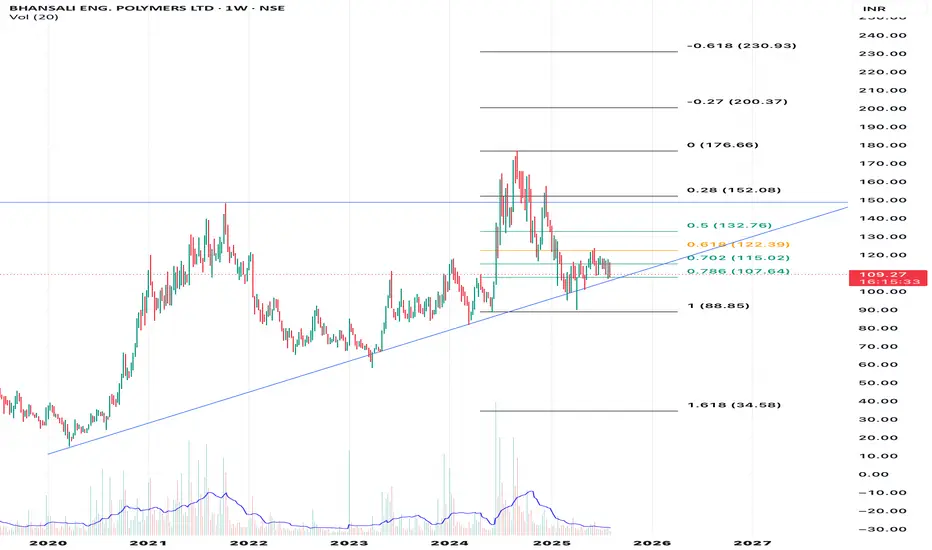
Weekly chart of Bhansali Engineering Polymers Ltd (BEPL) on NSE

🔍 Technical Analysis Summary
1. Current Price & Trend
• Current Price: ₹109.27
• Price Action:
• Price is sitting just above the 0.786 Fibonacci level (~₹107.64).
• It has pulled back from recent highs near ₹152.
• Currently hovering near the ascending trendline support from the 2020 lows.
⸻
2. Support & Resistance Levels
📉 Support Levels
• Trendline Support: Rising trendline from 2020 (~₹107–₹110 range).
• Fibonacci Support Levels:
• 0.786 Fib: ₹107.64 ✅ (Currently acting as support)
• 1.000 Fib: ₹88.85 (Major support if breakdown occurs)
📈 Resistance Levels
• Immediate Resistance:
• 0.702 Fib: ₹115.02
• 0.618 Fib: ₹122.39
• 0.5 Fib: ₹132.76
• Major Resistance:
• ₹152.08 (0.28 Fib) – previous swing high
⸻
3. Chart Patterns
• Symmetrical Triangle / Ascending Triangle Formation:
• Price is coiling within a tightening range between horizontal resistance and rising trendline.
• A breakout above ₹122–₹132 could indicate bullish continuation.
• Breakdown below ₹107 and especially ₹88.85 may trigger bearish momentum.
⸻
4. Volume Analysis
• Volume is relatively subdued recently.
• Previous price surges have been supported by spikes in volume — important to watch for volume breakout confirmation.
⸻
🧭 Possible Scenarios
✅ Bullish Scenario
• Hold above ₹107 support and break above ₹115–₹122 zone.
• Target: ₹132 (0.5 Fib) → ₹152 (swing high) → ₹176 → ₹200+
❌ Bearish Scenario
• Breakdown below ₹107 with volume.
• Breakdown of trendline → ₹88.85 (strong horizontal + Fib support)
• Deeper downside if ₹88 breaks → ₹34.58 (1.618 Fib extension)
⸻
🧠 Final Thoughts
• The chart is at a make-or-break zone, testing strong confluence of support (Fib 0.786 + rising trendline).
• Traders may watch ₹107 closely for support.
• Investors should keep an eye on a breakout above ₹122 with volume for potential re-entry.
Penafian
Maklumat dan penerbitan adalah tidak bertujuan, dan tidak membentuk, nasihat atau cadangan kewangan, pelaburan, dagangan atau jenis lain yang diberikan atau disahkan oleh TradingView. Baca lebih dalam Terma Penggunaan.
Penafian
Maklumat dan penerbitan adalah tidak bertujuan, dan tidak membentuk, nasihat atau cadangan kewangan, pelaburan, dagangan atau jenis lain yang diberikan atau disahkan oleh TradingView. Baca lebih dalam Terma Penggunaan.