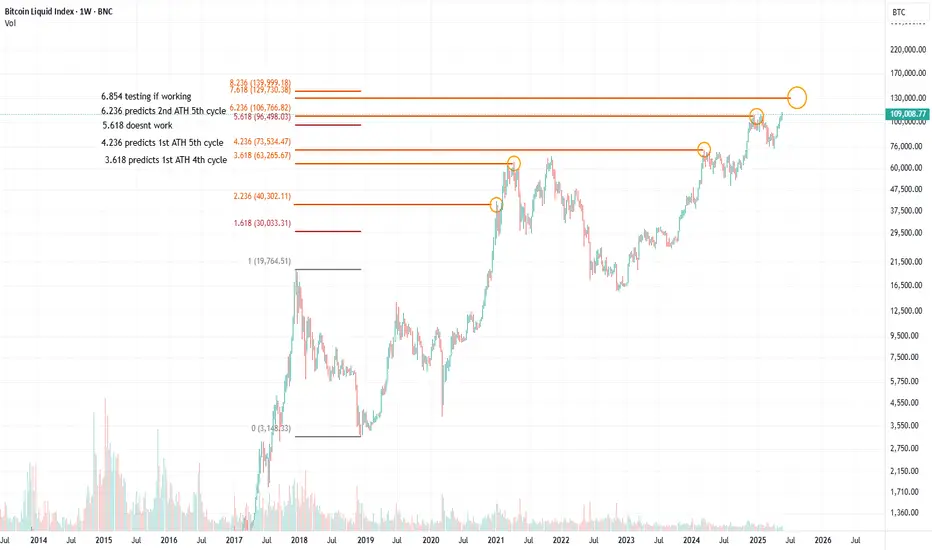
One single fib pull to rule them all. From top to bottom in 2018 we can clearly see how many significant levels we get:
The 2.236 level gives us the first ATH in 2021. After that we face a 30% pullback.
The 3.618 level gives us the 63k top in 2021, again to the absolute dollar.
The 4.236 level gives us the first ATH of 2024, after which we faced 230+ days of sideway nothingness.
[5.618 much like 1.618 doesnt show us anything]
The 6.236 level gives us the exact ATH at the end of 2024
Following the logic of these numbers the next levels we should look for are: 7.618 and 8.236
Penafian
The information and publications are not meant to be, and do not constitute, financial, investment, trading, or other types of advice or recommendations supplied or endorsed by TradingView. Read more in the Terms of Use.
Penafian
The information and publications are not meant to be, and do not constitute, financial, investment, trading, or other types of advice or recommendations supplied or endorsed by TradingView. Read more in the Terms of Use.