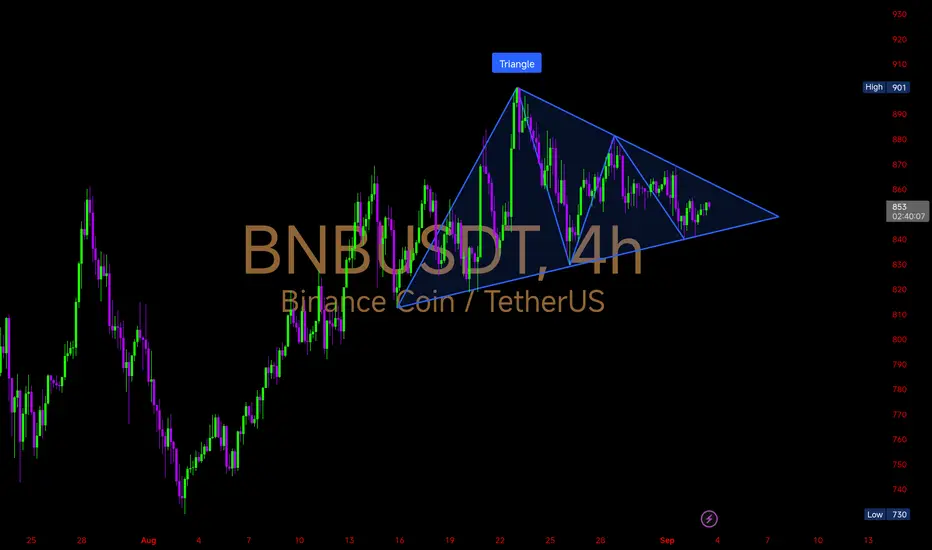
Price is consolidating inside a symmetrical triangle after the strong rally toward $901. This pattern signals a big breakout move ahead.
Key Levels
Upside Breakout Zone: $865 → $880 → $900
Downside Support Zone: $845 → $830 → $800
🔹A breakout above $865 could ignite momentum towards $900+, confirming trend continuation.
🔸 If price falls below $845, we may see a correction toward $820–800 before any recovery.
#BNB is coiling tighter. Expect volatility soon — whichever side breaks first will set the direction.
Penafian
Maklumat dan penerbitan adalah tidak dimaksudkan untuk menjadi, dan tidak membentuk, nasihat untuk kewangan, pelaburan, perdagangan dan jenis-jenis lain atau cadangan yang dibekalkan atau disahkan oleh TradingView. Baca dengan lebih lanjut di Terma Penggunaan.
Penafian
Maklumat dan penerbitan adalah tidak dimaksudkan untuk menjadi, dan tidak membentuk, nasihat untuk kewangan, pelaburan, perdagangan dan jenis-jenis lain atau cadangan yang dibekalkan atau disahkan oleh TradingView. Baca dengan lebih lanjut di Terma Penggunaan.