📊 Technical Indicators (Weekly)
Relative Strength Index (RSI): 41.73 — Indicates a neutral stance, neither overbought nor oversold.
Moving Average Convergence Divergence (MACD): -25.66 — Suggests a bearish trend, with the MACD line below the signal line.
Average Directional Index (ADX): 20.38 — Points to a weak trend, implying indecision in the stock's movement.
Commodity Channel Index (CCI): -132.30 — Reflects a mildly bullish condition, though caution is advised.
Williams %R: -84.06 — Indicates a mildly bullish position, suggesting potential upward movement.
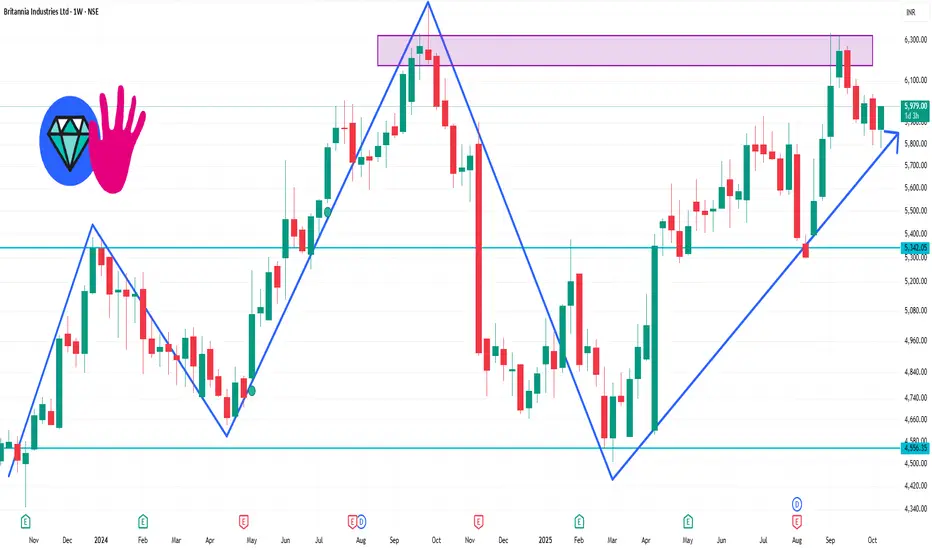
📈 Price Action & Trend
Weekly High: ₹5,953.00
Weekly Low: ₹5,782.00
Current Price: ₹5,800.50
Weekly Return: +1.47%
The stock has shown resilience, trading above its 200-day simple moving average (SMA), which is considered a positive long-term indicator.
Relative Strength Index (RSI): 41.73 — Indicates a neutral stance, neither overbought nor oversold.
Moving Average Convergence Divergence (MACD): -25.66 — Suggests a bearish trend, with the MACD line below the signal line.
Average Directional Index (ADX): 20.38 — Points to a weak trend, implying indecision in the stock's movement.
Commodity Channel Index (CCI): -132.30 — Reflects a mildly bullish condition, though caution is advised.
Williams %R: -84.06 — Indicates a mildly bullish position, suggesting potential upward movement.
📈 Price Action & Trend
Weekly High: ₹5,953.00
Weekly Low: ₹5,782.00
Current Price: ₹5,800.50
Weekly Return: +1.47%
The stock has shown resilience, trading above its 200-day simple moving average (SMA), which is considered a positive long-term indicator.
Penerbitan berkaitan
Penafian
Maklumat dan penerbitan adalah tidak bertujuan, dan tidak membentuk, nasihat atau cadangan kewangan, pelaburan, dagangan atau jenis lain yang diberikan atau disahkan oleh TradingView. Baca lebih dalam Terma Penggunaan.
Penerbitan berkaitan
Penafian
Maklumat dan penerbitan adalah tidak bertujuan, dan tidak membentuk, nasihat atau cadangan kewangan, pelaburan, dagangan atau jenis lain yang diberikan atau disahkan oleh TradingView. Baca lebih dalam Terma Penggunaan.