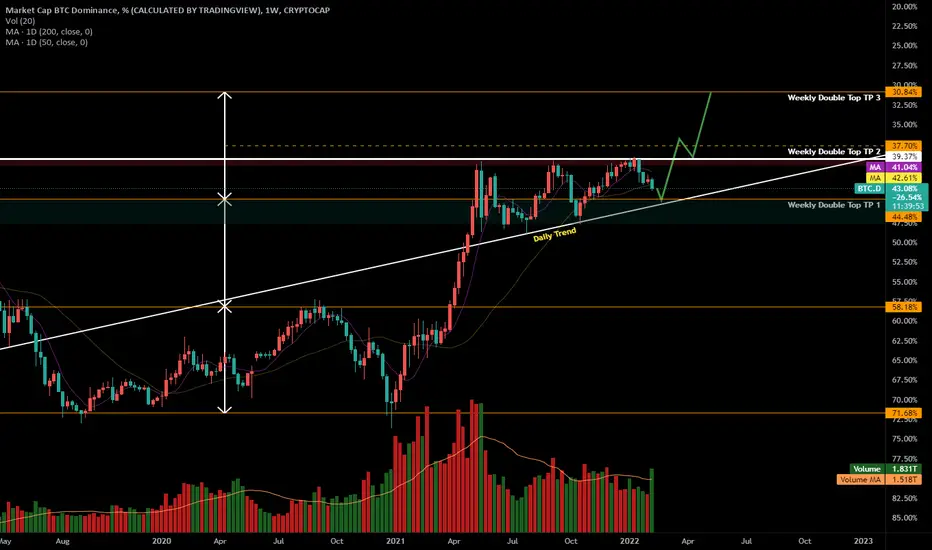
We saw a double top form prior to the massive correction on BTC.D. Price is consolidating around TP 1 of our double top target. We've gotten back above the daily 200 MA for the 2nd time. Last time that occurred we had a sharp rise followed by a sharp drop. We've also formed a wedge here with each attempt to break below 39-40% gaining strength.
It's possible we witness similar behavior to the previous push above the daily 200 MA, a brief and sharp rise towards the area around TP 1 and the top of our wedge, followed by a strong drop that results in breaking below our wedge and heading towards TP 2 and the 1.5x measured double top target.
TP 3 is a stretch goal at the 2x measured target. Chart is inverted for perspective.
Penafian
Maklumat dan penerbitan adalah tidak dimaksudkan untuk menjadi, dan tidak membentuk, nasihat untuk kewangan, pelaburan, perdagangan dan jenis-jenis lain atau cadangan yang dibekalkan atau disahkan oleh TradingView. Baca dengan lebih lanjut di Terma Penggunaan.
Penafian
Maklumat dan penerbitan adalah tidak dimaksudkan untuk menjadi, dan tidak membentuk, nasihat untuk kewangan, pelaburan, perdagangan dan jenis-jenis lain atau cadangan yang dibekalkan atau disahkan oleh TradingView. Baca dengan lebih lanjut di Terma Penggunaan.