---- Short-term Analysis for the next coming days - Hourly Chart (LOG)-------
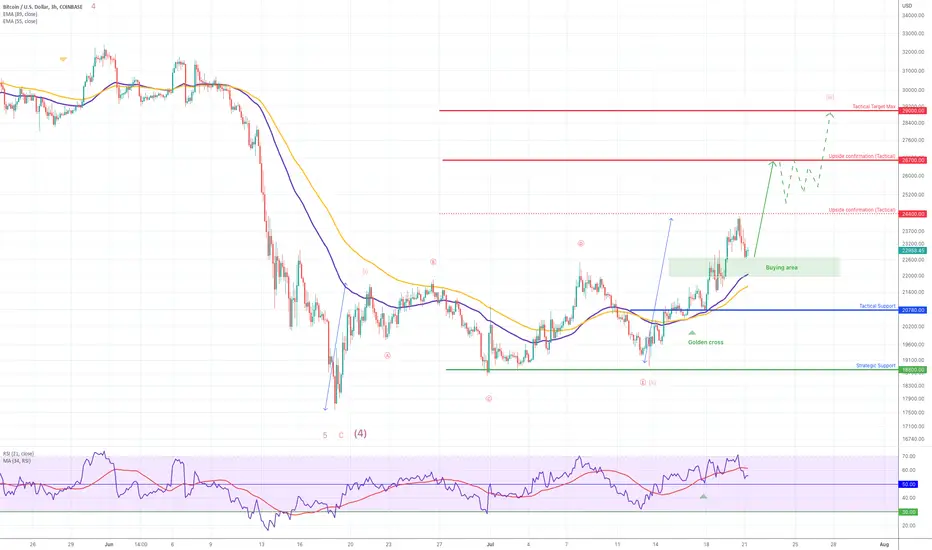
BTC/USDT: Upside confirmation level @ 24400 reached - what next?
Context
- The BTC reversed up above yearly key support at 18880 (excess 17900) before drawing a start of bullish reversal in parallel of ETH and Nasdaq and SP500
- The short-term upside potential at 24400 has been reached, now what to focus on to follow the actuel bullish momentum (see below)
previous analysis 11/07/2022 : https://www.tradingview.com/chart/BTCUSD/0khu1JVr-BTC-USDT-Bullish-set-up-above-18800-19800-update/
Market configuration
- Graphical Elements :
Graphical Resistance = 24400 & 26700
Graphical Support = 18800 & 20780
- Mathematical Indicators:
EMA ( Exp Moving averages) are support with a ''golden cross'' = Bullish
RSI indicator (below) is progressing within positive area above 50% = Bullish to Neutral
- Elliot & Harmonic Wave (Fibonacci):
Fibonacci Target (4) has been already reached = 18800
Fibonacci support of the wave in progress (III) = 20780
Fibonacci Bullish Target = 26700
Fibonacci Bearish Target = 18800
Conclusion
Preferred case => As long as 20780 remains support, we are focus on a bullish breakout of 24400 in order to give the final confirmation for a bullish reversal and open 26700 max 29000 area
Alternative case => Breaking 20780 new bearish attack towards 18800 will occur (double bottom)
Dagangan aktif
a larger rise is expected after FED decisionCIO & Head of market research (Automata - Vancelian)
vancelian.com/en
vancelian.com/en
Penafian
Maklumat dan penerbitan adalah tidak dimaksudkan untuk menjadi, dan tidak membentuk, nasihat untuk kewangan, pelaburan, perdagangan dan jenis-jenis lain atau cadangan yang dibekalkan atau disahkan oleh TradingView. Baca dengan lebih lanjut di Terma Penggunaan.
CIO & Head of market research (Automata - Vancelian)
vancelian.com/en
vancelian.com/en
Penafian
Maklumat dan penerbitan adalah tidak dimaksudkan untuk menjadi, dan tidak membentuk, nasihat untuk kewangan, pelaburan, perdagangan dan jenis-jenis lain atau cadangan yang dibekalkan atau disahkan oleh TradingView. Baca dengan lebih lanjut di Terma Penggunaan.