It looks like Bitcoin has entered the large consolidation period. It could take some time to evolve.
Wave A down was quick and strong and it could be over.
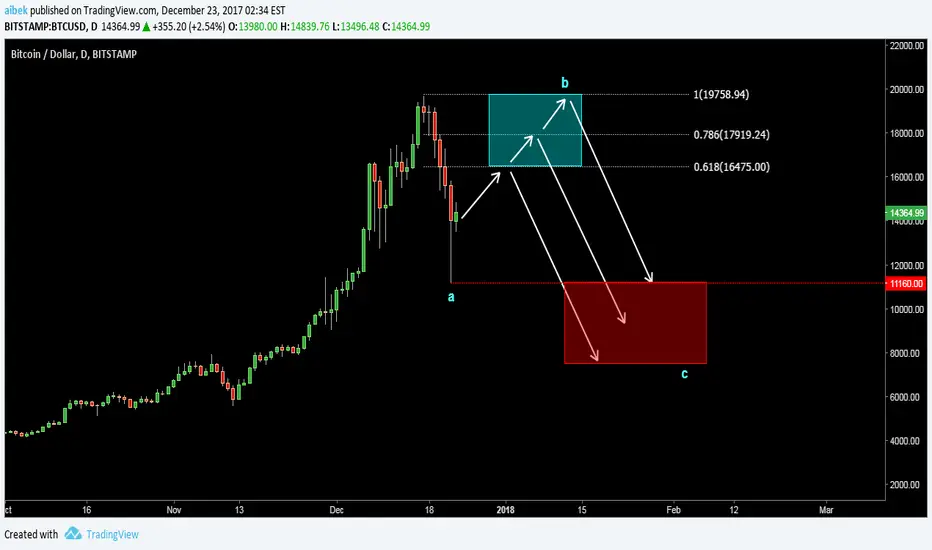
Now there should be the wave B correction of wave A and I highlighted the potential area of retracement with blue rectangle.
After it finishes we can see another dip in the wave C at least to the low of the wave A at 11160 level.
The projection for wave C should be recalculated once the wave B is done. Meanwhile it is highlighted with the red rectangle.
Wave A down was quick and strong and it could be over.
Now there should be the wave B correction of wave A and I highlighted the potential area of retracement with blue rectangle.
After it finishes we can see another dip in the wave C at least to the low of the wave A at 11160 level.
The projection for wave C should be recalculated once the wave B is done. Meanwhile it is highlighted with the red rectangle.
Nota
Countertrend consolidation within a large correction, Last wave up is underway.It can hit anywhere between 15900 and 18600 and then drop.
Dagangan ditutup: sasaran tercapai
Penafian
Maklumat dan penerbitan adalah tidak bertujuan, dan tidak membentuk, nasihat atau cadangan kewangan, pelaburan, dagangan atau jenis lain yang diberikan atau disahkan oleh TradingView. Baca lebih dalam Terma Penggunaan.
Penafian
Maklumat dan penerbitan adalah tidak bertujuan, dan tidak membentuk, nasihat atau cadangan kewangan, pelaburan, dagangan atau jenis lain yang diberikan atau disahkan oleh TradingView. Baca lebih dalam Terma Penggunaan.