#BTCUSD  BTCUSD
  BTCUSDT
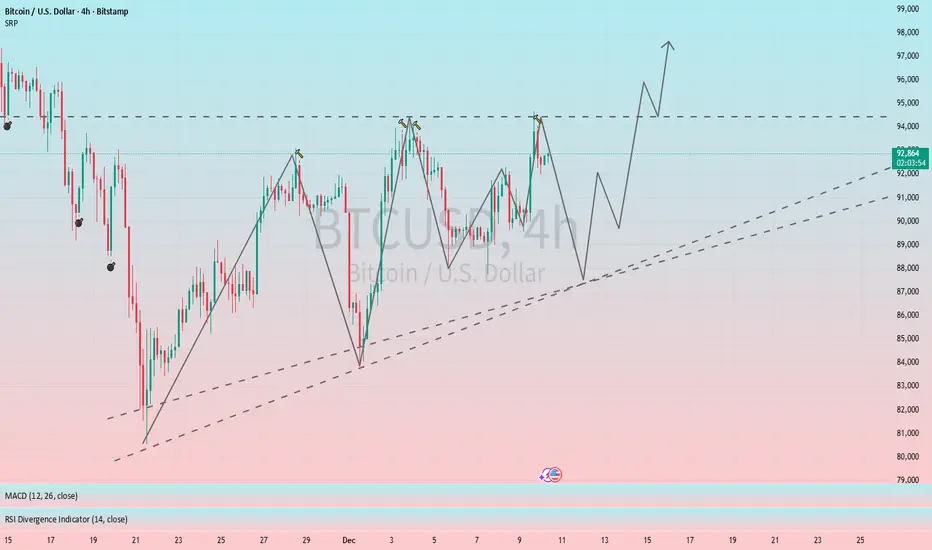
From the 4H chart, BTC's short-term trend has formed an ascending triangle pattern, which is a typical bullish pattern. Short-term resistance is located at 93500-94500, a break above this level would likely lead to further gains. The key support level to watch is 88000-87500. If the price retraces to this range, we can consider going long on BTC.
From the 4H chart, BTC's short-term trend has formed an ascending triangle pattern, which is a typical bullish pattern. Short-term resistance is located at 93500-94500, a break above this level would likely lead to further gains. The key support level to watch is 88000-87500. If the price retraces to this range, we can consider going long on BTC.
📊Free trading discussion group📊
t.me/Elite_Exchange_G
✅1-3 trading signals daily
🔥Win rate 88%-95%
Do complex things simply, do simple things repeatedly, and do repetitive things with care.
t.me/Elite_Exchange_G
✅1-3 trading signals daily
🔥Win rate 88%-95%
Do complex things simply, do simple things repeatedly, and do repetitive things with care.
Penafian
Maklumat dan penerbitan adalah tidak bertujuan, dan tidak membentuk, nasihat atau cadangan kewangan, pelaburan, dagangan atau jenis lain yang diberikan atau disahkan oleh TradingView. Baca lebih dalam Terma Penggunaan.