Cryptocurrency markets can be susceptible to large swings in sentiment that can arrive out of nowhere and lead to outsized moves with potentially little rational behind why they have happened. These moves may be due to large one-off flows, reaction to news events, or just the liquidation of excessive positioning when a move may have run its course in the short term.
It seems that yesterday’s drop could have been one of those days. BTCUSD opened Monday around 115500, right in the middle of its recent 110-118k trading range of the last 3 weeks. Then, at the start of trading in Europe the price dropped quickly to touch a low of 111533 before rebounding. This type of surprise move can catch traders unaware or worse can evoke an emotional response that can lead to making a rash decision regarding the execution of a new or existing position.
To help protect against this type of reaction, from a risk management perspective it can be helpful to assess the charts at the start of each day to get a feel for market sentiment and positioning, as well as to try and identify some relevant support and resistance levels to monitor, alongside the current BTCUSD trend on the particular timeframe that you are trading.
In the technical assessment below, we provide examples of this type of approach that you could adapt to fit your own style.
While, BTCUSD prices have edged back higher again this morning, this pre-trading routine can become a quick and useful way to assess cryptocurrency markets.
Technical Update: Assessing the Technical Backdrop
Monday’s sharp decline might well have caught many traders off guard, prompting emotional reactions and potentially rash decisions. As experience shows, emotion-driven trades often lead to poor timing - buying near session highs or selling near market lows.
While sharp price moves are unpredictable, preparing ahead of the trading day or week may help manage the emotional challenges that come with trading.
Forearmed is Forewarned
Before starting your trading day, build a routine that includes reviewing charts across multiple timeframes, such as 15 minute, 1 hour, 4 hour, daily or even weekly, for the assets you plan to trade. This broader perspective might help you spot key trends and make more informed decisions.
This doesn’t need to be a deep analysis, just note the trend direction across different timeframes to get a clearer picture before trading.
For a quick trend check, you can consider using the Bollinger Band mid-average (typically the 20-period moving average). If it’s rising, the asset is likely to be in an uptrend; if its falling, a downtrend; and if flat, it suggests a sideways range.
When analysing multiple timeframes, keep in mind that longer-term trends may carry more weight. For example, a trend on a 1 day chart is perhaps more significant than one on a 5 minute chart. Short-term trends can reverse quickly, while longer-term moves tend to be more stable and influential.
Consider using your trend assessment to shape your trading bias for the session. You may find it’s more effective to trade with the dominant trend rather than against it, at least until there's clear evidence of a price reversal.
Be Aware of Support and Resistance Levels
In addition to identifying the current trend direction, it's important to pinpoint key support and resistance levels for the session. These levels can help guide entry and exit decisions, highlight potential turning points, and provide structure to your trading plan.
Keep these levels close to you throughout the day. Perhaps identify one key support and one resistance level, if either is breached, it may signal your initial assessment was incorrect and a trend reversal is underway.
Support is often marked by prior lows or areas where buyers previously halted a price decline and helped restore the prevailing uptrend. Consider placing sell stop losses below a support level you have identified.
Resistance is typically identified by prior highs or areas where sellers previously capped a rally and reinforced the prevailing downtrend. Think about placing buy stop losses above a resistance level you have outlined.
A rising Bollinger mid-average also often serves as support, while a falling mid-average can signal resistance.
Fibonacci retracement levels - 38.2%, 50%, and 61.8% - can also highlight potential support levels during pullbacks in an uptrend or resistance levels during recoveries in a downtrend. These may also be useful additions to be included in your pre-trading routine.

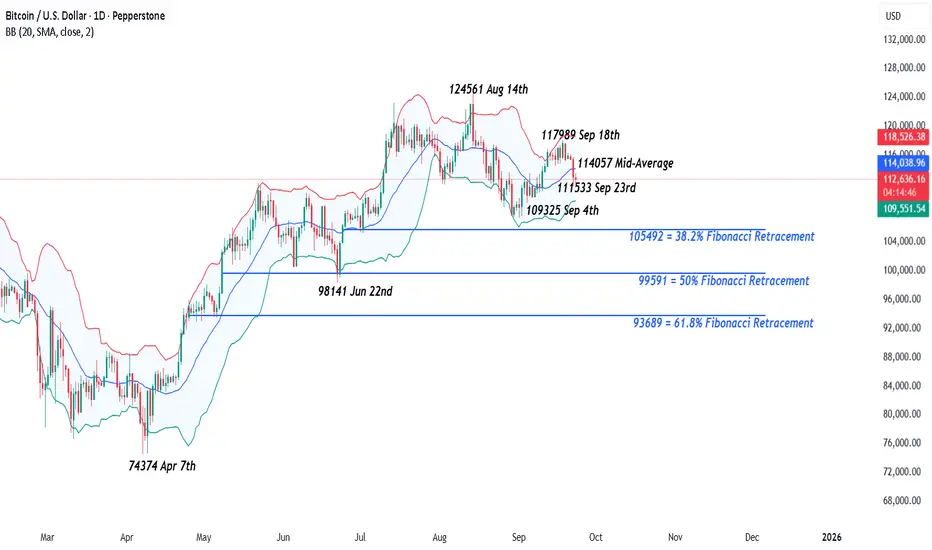
The chart above highlights examples of possible support and resistance levels for Bitcoin within the daily timeframe.
Let’s now look at what might be the current daily trends and support/resistance levels for Bitcoin for the daily perspective
Potential Daily Trend:
Monday’s sharp sell-off did see a break below what at the time was potential support, marked by the Bollinger mid-average, and price action staying below the average may suggest risks of a downtrend.
However, as shown in the above chart, the daily Bollinger mid-average is currently flat, indicating Bitcoin may be in a daily sideways range. A downturn might suggest a developing downtrend, while an upward shift in the average could signal a renewed uptrend.
Potential Daily Support and Resistance Levels:
The Bollinger mid-average currently at 114057 may suggest an initial daily resistance. A break above this level might lead to further strength, with the September 20th high at 116205 and the September 18th peak at 117989 as potential next resistance levels.
The recent low at 111533 may now be considered as an initial daily support level. A close below here could shift the focus to the September 4th low at 109325 as the next support to monitor.
You can of course refine these levels by analysing shorter timeframes to match your trading style and perhaps spot near-term opportunities.
However, by understanding key trends and support/resistance zones across various timeframes before the trading day begins, you may well find you are better equipped to deal with unexpected price swings with more balance and less emotion.
The material provided here has not been prepared accordance with legal requirements designed to promote the independence of investment research and as such is considered to be a marketing communication. Whilst it is not subject to any prohibition on dealing ahead of the dissemination of investment research, we will not seek to take any advantage before providing it to our clients.
Pepperstone doesn’t represent that the material provided here is accurate, current or complete, and therefore shouldn’t be relied upon as such. The information, whether from a third party or not, isn’t to be considered as a recommendation; or an offer to buy or sell; or the solicitation of an offer to buy or sell any security, financial product or instrument; or to participate in any particular trading strategy. It does not take into account readers’ financial situation or investment objectives. We advise any readers of this content to seek their own advice. Without the approval of Pepperstone, reproduction or redistribution of this information isn’t permitted.
It seems that yesterday’s drop could have been one of those days. BTCUSD opened Monday around 115500, right in the middle of its recent 110-118k trading range of the last 3 weeks. Then, at the start of trading in Europe the price dropped quickly to touch a low of 111533 before rebounding. This type of surprise move can catch traders unaware or worse can evoke an emotional response that can lead to making a rash decision regarding the execution of a new or existing position.
To help protect against this type of reaction, from a risk management perspective it can be helpful to assess the charts at the start of each day to get a feel for market sentiment and positioning, as well as to try and identify some relevant support and resistance levels to monitor, alongside the current BTCUSD trend on the particular timeframe that you are trading.
In the technical assessment below, we provide examples of this type of approach that you could adapt to fit your own style.
While, BTCUSD prices have edged back higher again this morning, this pre-trading routine can become a quick and useful way to assess cryptocurrency markets.
Technical Update: Assessing the Technical Backdrop
Monday’s sharp decline might well have caught many traders off guard, prompting emotional reactions and potentially rash decisions. As experience shows, emotion-driven trades often lead to poor timing - buying near session highs or selling near market lows.
While sharp price moves are unpredictable, preparing ahead of the trading day or week may help manage the emotional challenges that come with trading.
Forearmed is Forewarned
Before starting your trading day, build a routine that includes reviewing charts across multiple timeframes, such as 15 minute, 1 hour, 4 hour, daily or even weekly, for the assets you plan to trade. This broader perspective might help you spot key trends and make more informed decisions.
This doesn’t need to be a deep analysis, just note the trend direction across different timeframes to get a clearer picture before trading.
For a quick trend check, you can consider using the Bollinger Band mid-average (typically the 20-period moving average). If it’s rising, the asset is likely to be in an uptrend; if its falling, a downtrend; and if flat, it suggests a sideways range.
When analysing multiple timeframes, keep in mind that longer-term trends may carry more weight. For example, a trend on a 1 day chart is perhaps more significant than one on a 5 minute chart. Short-term trends can reverse quickly, while longer-term moves tend to be more stable and influential.
Consider using your trend assessment to shape your trading bias for the session. You may find it’s more effective to trade with the dominant trend rather than against it, at least until there's clear evidence of a price reversal.
Be Aware of Support and Resistance Levels
In addition to identifying the current trend direction, it's important to pinpoint key support and resistance levels for the session. These levels can help guide entry and exit decisions, highlight potential turning points, and provide structure to your trading plan.
Keep these levels close to you throughout the day. Perhaps identify one key support and one resistance level, if either is breached, it may signal your initial assessment was incorrect and a trend reversal is underway.
Support is often marked by prior lows or areas where buyers previously halted a price decline and helped restore the prevailing uptrend. Consider placing sell stop losses below a support level you have identified.
Resistance is typically identified by prior highs or areas where sellers previously capped a rally and reinforced the prevailing downtrend. Think about placing buy stop losses above a resistance level you have outlined.
A rising Bollinger mid-average also often serves as support, while a falling mid-average can signal resistance.
Fibonacci retracement levels - 38.2%, 50%, and 61.8% - can also highlight potential support levels during pullbacks in an uptrend or resistance levels during recoveries in a downtrend. These may also be useful additions to be included in your pre-trading routine.
The chart above highlights examples of possible support and resistance levels for Bitcoin within the daily timeframe.
Let’s now look at what might be the current daily trends and support/resistance levels for Bitcoin for the daily perspective
Potential Daily Trend:
Monday’s sharp sell-off did see a break below what at the time was potential support, marked by the Bollinger mid-average, and price action staying below the average may suggest risks of a downtrend.
However, as shown in the above chart, the daily Bollinger mid-average is currently flat, indicating Bitcoin may be in a daily sideways range. A downturn might suggest a developing downtrend, while an upward shift in the average could signal a renewed uptrend.
Potential Daily Support and Resistance Levels:
The Bollinger mid-average currently at 114057 may suggest an initial daily resistance. A break above this level might lead to further strength, with the September 20th high at 116205 and the September 18th peak at 117989 as potential next resistance levels.
The recent low at 111533 may now be considered as an initial daily support level. A close below here could shift the focus to the September 4th low at 109325 as the next support to monitor.
You can of course refine these levels by analysing shorter timeframes to match your trading style and perhaps spot near-term opportunities.
However, by understanding key trends and support/resistance zones across various timeframes before the trading day begins, you may well find you are better equipped to deal with unexpected price swings with more balance and less emotion.
The material provided here has not been prepared accordance with legal requirements designed to promote the independence of investment research and as such is considered to be a marketing communication. Whilst it is not subject to any prohibition on dealing ahead of the dissemination of investment research, we will not seek to take any advantage before providing it to our clients.
Pepperstone doesn’t represent that the material provided here is accurate, current or complete, and therefore shouldn’t be relied upon as such. The information, whether from a third party or not, isn’t to be considered as a recommendation; or an offer to buy or sell; or the solicitation of an offer to buy or sell any security, financial product or instrument; or to participate in any particular trading strategy. It does not take into account readers’ financial situation or investment objectives. We advise any readers of this content to seek their own advice. Without the approval of Pepperstone, reproduction or redistribution of this information isn’t permitted.
Global risk Warning CFDs are complex instruments and come with a high risk of losing money rapidly due to leverage. Between 74-89% of retail investor accounts lose money when trading in CFDs. You should consider whether you understand how CFD
Penafian
Maklumat dan penerbitan adalah tidak dimaksudkan untuk menjadi, dan tidak membentuk, nasihat untuk kewangan, pelaburan, perdagangan dan jenis-jenis lain atau cadangan yang dibekalkan atau disahkan oleh TradingView. Baca dengan lebih lanjut di Terma Penggunaan.