Technical analysis most times does not need many words.
Here we have a very bullish bitcoin BTCUSD

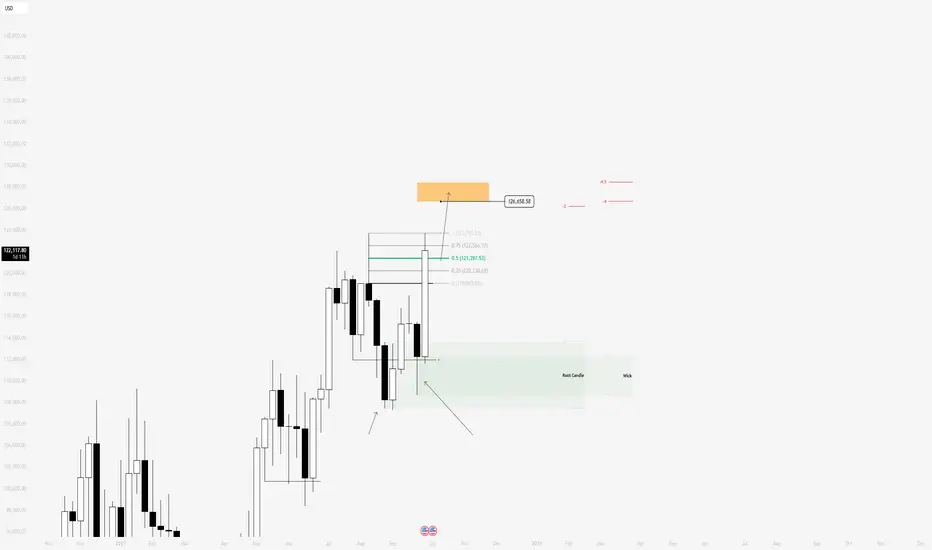
Using the wicks on the weekly chart, I can measure them and project values towards all time highs based on Market Maker Model Dynamics
The first projection, is the root candle of the current distribution
The second projection is the lower wick of the last re-accumulation before we had an expansion in the just concluded week.
Both projections, converge around 126k so I have my sights set on 126k
I anticipate the lower wick of the upcoming week to form around 121k (50% premium wick level)
See image below

BTCUSD
That's it.
Here we have a very bullish bitcoin
Using the wicks on the weekly chart, I can measure them and project values towards all time highs based on Market Maker Model Dynamics
The first projection, is the root candle of the current distribution
The second projection is the lower wick of the last re-accumulation before we had an expansion in the just concluded week.
Both projections, converge around 126k so I have my sights set on 126k
I anticipate the lower wick of the upcoming week to form around 121k (50% premium wick level)
See image below
That's it.
Penafian
Maklumat dan penerbitan adalah tidak dimaksudkan untuk menjadi, dan tidak membentuk, nasihat untuk kewangan, pelaburan, perdagangan dan jenis-jenis lain atau cadangan yang dibekalkan atau disahkan oleh TradingView. Baca dengan lebih lanjut di Terma Penggunaan.
Penafian
Maklumat dan penerbitan adalah tidak dimaksudkan untuk menjadi, dan tidak membentuk, nasihat untuk kewangan, pelaburan, perdagangan dan jenis-jenis lain atau cadangan yang dibekalkan atau disahkan oleh TradingView. Baca dengan lebih lanjut di Terma Penggunaan.