Bitcoin is flashing warning signs that the euphoria may be nearing a halt. While bulls have defended every dip for months, this recent structure exposes potential systemic exhaustion and a clear top-heavy formation.
🔶 Triple Top Formation – Major Reversal Pattern
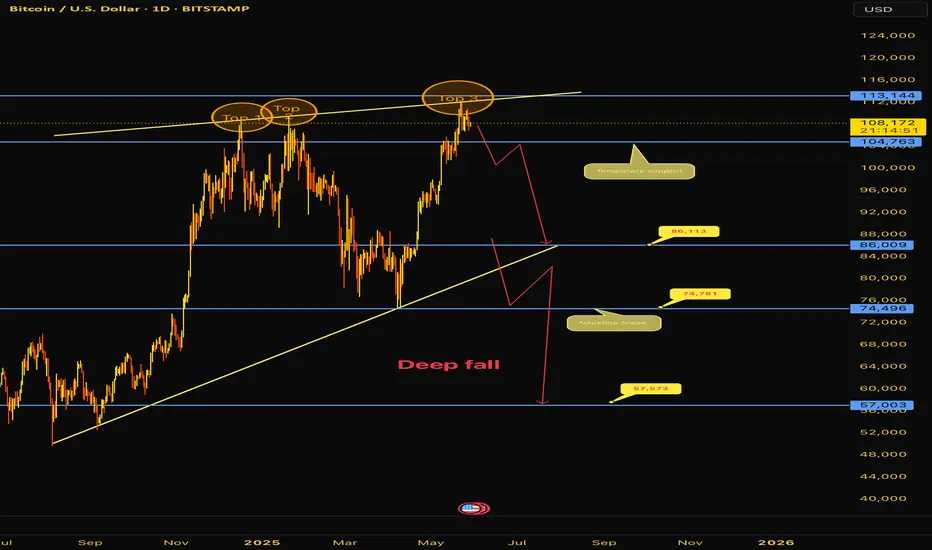
Price has formed three clear rejections near 111k to 113k failing to break this horizontal ceiling despite strong attempts:
• Top 1: Initial euphoric breakout in Q1 2025.
• Top 2: Mid-cycle rejection with lower momentum.
• Top 3: Final spike with a long upper wick, indicating selling pressure.
This isn’t just psychological resistance — this is institutional exit behavior. When a triple top aligns with bearish structure, the probabilities of reversal spike.
⸻
📐 Rising Wedge Breakdown Risk
Zooming into structure, BTC is also caught in a rising wedge, a pattern that typically precedes a sharp trend reversal when the lower trendline fails.
• This wedge began forming since the $57K low in January 2025, and has now reached terminal compression.
• Breakout attempt failed to sustain new highs, now back inside the wedge.
If price breaks down with volume, it confirms distribution at the top.
⸻
🧠 Multi-Layered Breakdown Zones
Here’s the full structure unraveling beneath:
🟡 Immediate Support (Temporary Relief):
• 104,763 is the first demand zone. However, this is weak and already being tested.
🟡 Critical Breakdown Trigger (Trendline + Horizontal Confluence):
• 86,113 aligns with wedge base and horizontal structure. Losing this is not a dip — it’s a structural breach.
🟡 Neckline of the Triple Top:
• 74,496 – this is the last defense. A breakdown here activates the full triple-top bearish target.
⸻
📉 Projected Pathway – Full Breakdown Sequence
If price fails to reclaim 113K, here’s the probable sequence:
1. Failure to hold 104K → Drop to 86K.
2. Weak bounce from 86K followed by breakdown → retest neckline at 74.5K.
3. Neckline breaks → Full triple top target opens towards 57,000–58,000 zone.
🔻 Target: 57,003 – Aligns with historical pivot from Nov 2024 and major liquidity grab.
⸻
💬 Macro Interpretation
While spot price remains above key zones, the underlying structure has flipped bearish:
• Every push higher is met with lower momentum.
• Trendline losing steam, and volume failing to confirm rallies.
• This looks like a top-heavy distribution, not accumulation.
⸻
⚠️ What to Watch Now
• Daily closes below 104K = early sign of pressure.
• Breakdown and daily close below 86K = breakdown from rising wedge.
• Neckline at 74,496 is the trap door. If this gives in, expect acceleration.
⸻
✅ Action Plan
• No fresh longs until BTC closes above 113K with conviction.
• Shorting below 104K with tight stops makes sense for intraday traders.
• Bigger positional shorts can be initiated on breakdown + retest of 86K.
• Full breakdown shorting zone activates below neckline retest.
⸻
📌 Summary:
Triple Top + Rising Wedge + Structural Failures = Recipe for Collapse.
BTC bulls need a miracle above 113K. Otherwise, price is setting up for a high-velocity drop toward 57K zone over the coming weeks.
🔶 Triple Top Formation – Major Reversal Pattern
Price has formed three clear rejections near 111k to 113k failing to break this horizontal ceiling despite strong attempts:
• Top 1: Initial euphoric breakout in Q1 2025.
• Top 2: Mid-cycle rejection with lower momentum.
• Top 3: Final spike with a long upper wick, indicating selling pressure.
This isn’t just psychological resistance — this is institutional exit behavior. When a triple top aligns with bearish structure, the probabilities of reversal spike.
⸻
📐 Rising Wedge Breakdown Risk
Zooming into structure, BTC is also caught in a rising wedge, a pattern that typically precedes a sharp trend reversal when the lower trendline fails.
• This wedge began forming since the $57K low in January 2025, and has now reached terminal compression.
• Breakout attempt failed to sustain new highs, now back inside the wedge.
If price breaks down with volume, it confirms distribution at the top.
⸻
🧠 Multi-Layered Breakdown Zones
Here’s the full structure unraveling beneath:
🟡 Immediate Support (Temporary Relief):
• 104,763 is the first demand zone. However, this is weak and already being tested.
🟡 Critical Breakdown Trigger (Trendline + Horizontal Confluence):
• 86,113 aligns with wedge base and horizontal structure. Losing this is not a dip — it’s a structural breach.
🟡 Neckline of the Triple Top:
• 74,496 – this is the last defense. A breakdown here activates the full triple-top bearish target.
⸻
📉 Projected Pathway – Full Breakdown Sequence
If price fails to reclaim 113K, here’s the probable sequence:
1. Failure to hold 104K → Drop to 86K.
2. Weak bounce from 86K followed by breakdown → retest neckline at 74.5K.
3. Neckline breaks → Full triple top target opens towards 57,000–58,000 zone.
🔻 Target: 57,003 – Aligns with historical pivot from Nov 2024 and major liquidity grab.
⸻
💬 Macro Interpretation
While spot price remains above key zones, the underlying structure has flipped bearish:
• Every push higher is met with lower momentum.
• Trendline losing steam, and volume failing to confirm rallies.
• This looks like a top-heavy distribution, not accumulation.
⸻
⚠️ What to Watch Now
• Daily closes below 104K = early sign of pressure.
• Breakdown and daily close below 86K = breakdown from rising wedge.
• Neckline at 74,496 is the trap door. If this gives in, expect acceleration.
⸻
✅ Action Plan
• No fresh longs until BTC closes above 113K with conviction.
• Shorting below 104K with tight stops makes sense for intraday traders.
• Bigger positional shorts can be initiated on breakdown + retest of 86K.
• Full breakdown shorting zone activates below neckline retest.
⸻
📌 Summary:
Triple Top + Rising Wedge + Structural Failures = Recipe for Collapse.
BTC bulls need a miracle above 113K. Otherwise, price is setting up for a high-velocity drop toward 57K zone over the coming weeks.
Dagangan aktif
Broken temporary resistance !! Eyes on the target . Trade activated .Stay ahead of the market—Follow my channel for free insights~~ Telegram channel link below !
t.me/+jvSU52DTZAphYTc1
youtube.com/@TeamSpark-08
t.me/+jvSU52DTZAphYTc1
youtube.com/@TeamSpark-08
Penafian
Maklumat dan penerbitan adalah tidak dimaksudkan untuk menjadi, dan tidak membentuk, nasihat untuk kewangan, pelaburan, perdagangan dan jenis-jenis lain atau cadangan yang dibekalkan atau disahkan oleh TradingView. Baca dengan lebih lanjut di Terma Penggunaan.
Stay ahead of the market—Follow my channel for free insights~~ Telegram channel link below !
t.me/+jvSU52DTZAphYTc1
youtube.com/@TeamSpark-08
t.me/+jvSU52DTZAphYTc1
youtube.com/@TeamSpark-08
Penafian
Maklumat dan penerbitan adalah tidak dimaksudkan untuk menjadi, dan tidak membentuk, nasihat untuk kewangan, pelaburan, perdagangan dan jenis-jenis lain atau cadangan yang dibekalkan atau disahkan oleh TradingView. Baca dengan lebih lanjut di Terma Penggunaan.