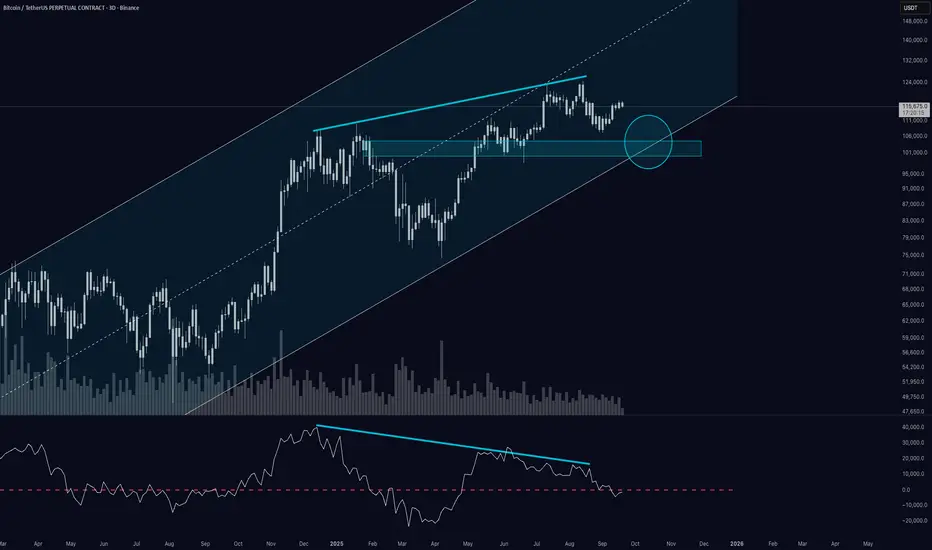
On the 3-day chart, Bitcoin continues to respect its long-term ascending channel, with both the upper and lower boundaries acting as clean structural guides.
🔹 Momentum: After months of strength, momentum has slipped below the 0-line and is currently retesting it – a key pivot that often defines whether trend continuation or correction follows.
🔹 Structure: The lower boundary of the channel lines up almost perfectly with the horizontal support zone built from previous highs (around 100k–103k). This confluence makes it a natural candidate for a pullback area.
🔹 Volume: A noteworthy observation is the declining volume profile during the most recent leg higher – a potential early warning that participation is fading.
If the 100k–103k support area holds, the long-term uptrend remains intact.
But a decisive breakdown could open the door to a deeper correction.
👉 What do you think – is Bitcoin gearing up for another strong bounce off the channel, or are we on the edge of a deeper retracement?
Let’s discuss in the comments.
Disclaimer: This is a market observation, not financial advice.
Penafian
Maklumat dan penerbitan adalah tidak dimaksudkan untuk menjadi, dan tidak membentuk, nasihat untuk kewangan, pelaburan, perdagangan dan jenis-jenis lain atau cadangan yang dibekalkan atau disahkan oleh TradingView. Baca dengan lebih lanjut di Terma Penggunaan.
Penafian
Maklumat dan penerbitan adalah tidak dimaksudkan untuk menjadi, dan tidak membentuk, nasihat untuk kewangan, pelaburan, perdagangan dan jenis-jenis lain atau cadangan yang dibekalkan atau disahkan oleh TradingView. Baca dengan lebih lanjut di Terma Penggunaan.