BTC — Identifying High-Probability Long Zone With Confluence
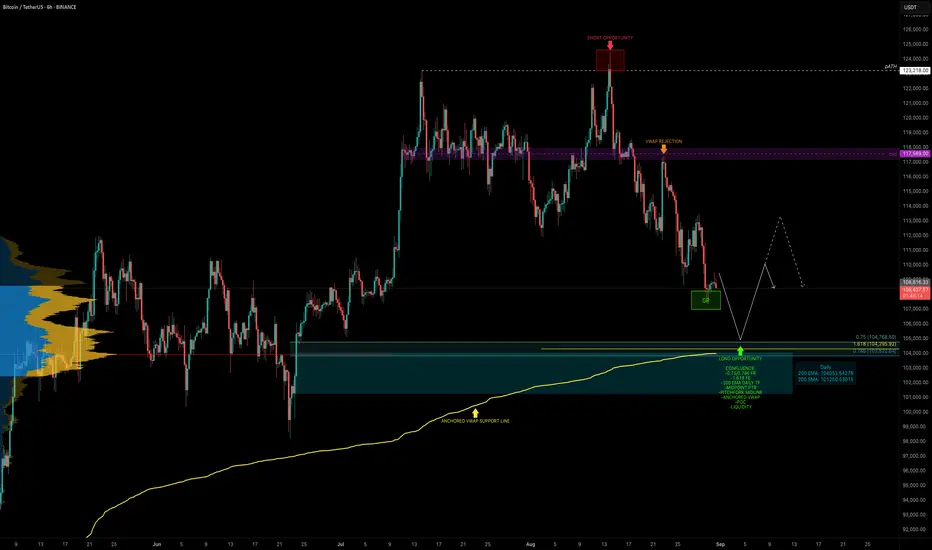
BTC has been in a 17-day downtrend since the swing failure at the ATH (~$124.5K). That move acted as both a bull trap and the completion of a 5-wave structure, offering an excellent short entry at the highs.
Now the key question: where is BTC heading next, and where is the next high-probability trade setup?
Current Situation
BTC is sitting at the 0.618 Fib retracement ($108,236) of the move from $98.2K → $124.5K. Many traders are already buying this level, which is valid but a deeper zone below offers stronger confluence.
🧩 Confluence Zone: $105K–$104K
This creates a high-confluence support cluster between $105K–$104K, making it the next strong long setup.
🟢 Long Trade Setup
Technical Insight
🔍 Indicators used
➡️ Available for free. You can find it on my profile under “Scripts” and apply it directly to your charts for extra confluence when planning your trades.
_________________________________
💬 If you found this helpful, drop a like and comment!
Now the key question: where is BTC heading next, and where is the next high-probability trade setup?
Current Situation
BTC is sitting at the 0.618 Fib retracement ($108,236) of the move from $98.2K → $124.5K. Many traders are already buying this level, which is valid but a deeper zone below offers stronger confluence.
🧩 Confluence Zone: $105K–$104K
- POC of the previous trading range → ~$104K
- 0.75 Fib retracement: $104,768.5
- 0.786 Fib retracement: $103,823
- Anchored VWAP (from swing low $74,508) → just above the 0.786 Fib
- Midpoint of the previous 60-day range
- Liquidity cluster → positioned around $105K–$104K
- 1.618 Fib extension target: $104,296
- Pitchfork midline → supporting this level
- 200 EMA (daily) → adding dynamic support at ~$104K
This creates a high-confluence support cluster between $105K–$104K, making it the next strong long setup.
🟢 Long Trade Setup
- Entry Zone: $106K–$104K
- Stop-Loss: Below $103K
- TP: $110K-$114K
- R:R Potential: 1:2+
Technical Insight
- The ATH rejection confirmed both bullish exhaustion and a completed 5-wave move, triggering the current correction.
- While the 0.618 retracement offers valid support, the $105K–$104K zone holds significantly stronger confluence.
- This makes it the most attractive high-probability long entry zone in the current structure.
🔍 Indicators used
- Multi Timeframe 8x MA Support Resistance Zones [SiDec] → to identify support and resistance zones such as the daily 200 EMA/SMA.
➡️ Available for free. You can find it on my profile under “Scripts” and apply it directly to your charts for extra confluence when planning your trades.
_________________________________
💬 If you found this helpful, drop a like and comment!
Pesanan dibatalkan
BTC found support at the golden pocket and bounced.The ideal long entry at ~105K wasn’t reached
🏆 Mastering Fibonacci for precision trading
🔹 Sharing high-probability trade setups
⚡ Unlock the power of technical analysis!
🔹 Sharing high-probability trade setups
⚡ Unlock the power of technical analysis!
Penerbitan berkaitan
Penafian
Maklumat dan penerbitan adalah tidak dimaksudkan untuk menjadi, dan tidak membentuk, nasihat untuk kewangan, pelaburan, perdagangan dan jenis-jenis lain atau cadangan yang dibekalkan atau disahkan oleh TradingView. Baca dengan lebih lanjut di Terma Penggunaan.