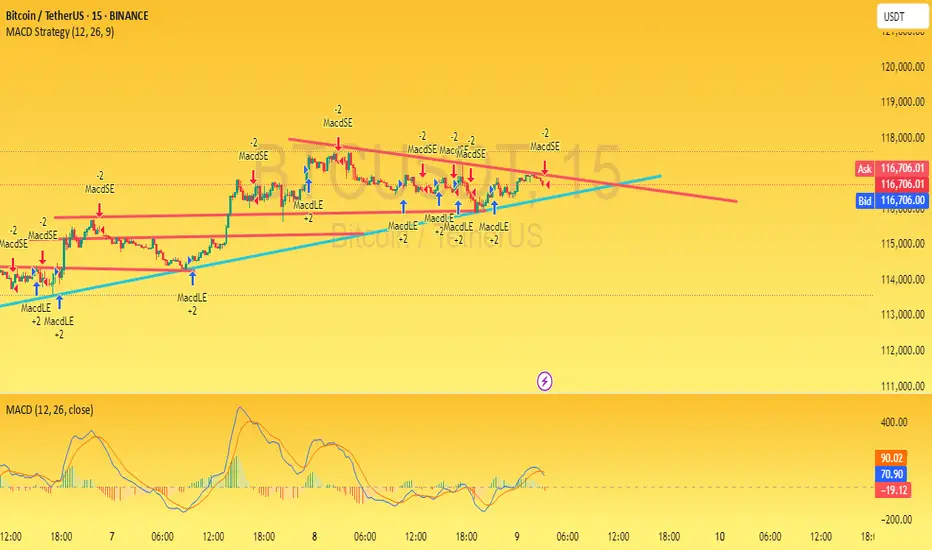
In the 15-minute chart of BTCUSDT, the price is currently approaching a significant resistance level. Based on the MACD indicator, bullish momentum is gradually building up, which may lead to a breakout above this resistance. If the breakout occurs with strong volume, the price is likely to move higher, potentially opening the way for short-term bullish opportunities.
However, if the price fails to break above this level and faces rejection, it could signal a shift in market sentiment, leading to a potential downside move. In such a case, we might see the market testing lower support levels in the short term.
Traders should monitor the breakout zone closely and wait for confirmation before entering a position. Managing risk with a proper stop-loss is essential given the volatility on lower timeframes.
Penafian
Maklumat dan penerbitan adalah tidak dimaksudkan untuk menjadi, dan tidak membentuk, nasihat untuk kewangan, pelaburan, perdagangan dan jenis-jenis lain atau cadangan yang dibekalkan atau disahkan oleh TradingView. Baca dengan lebih lanjut di Terma Penggunaan.
Penafian
Maklumat dan penerbitan adalah tidak dimaksudkan untuk menjadi, dan tidak membentuk, nasihat untuk kewangan, pelaburan, perdagangan dan jenis-jenis lain atau cadangan yang dibekalkan atau disahkan oleh TradingView. Baca dengan lebih lanjut di Terma Penggunaan.