📈 Bitcoin Technical Analysis – Breakout Above Key Resistance Zone
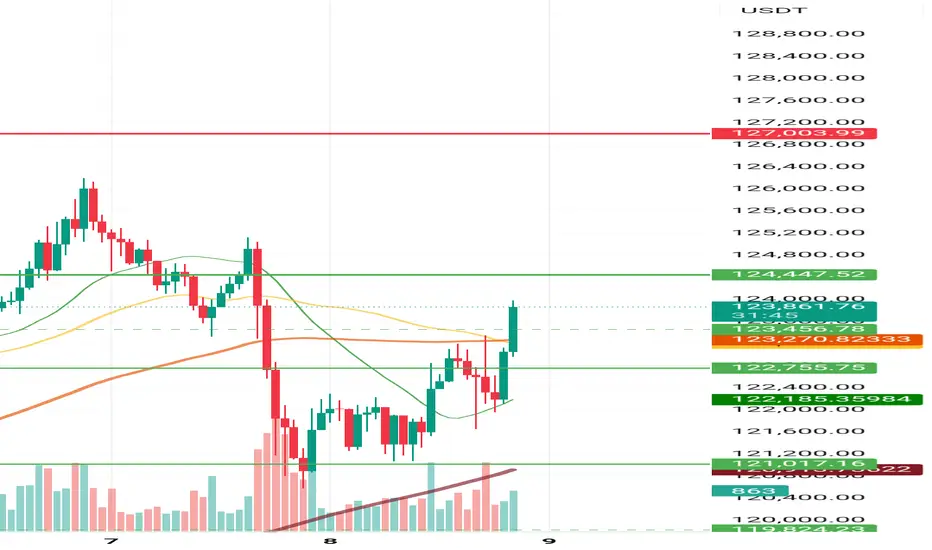
After a healthy correction, Bitcoin found strong support around the 121,000 USDT level, where it formed a solid base and initiated a bullish reversal. This support zone has historically acted as a pivotal level, and the recent reaction confirms its continued relevance.
The price successfully broke through the 122,755–123,000 USDT resistance range, which had previously taken over 34 hours to breach. This time, the breakout was more decisive, backed by a surge in volume and reinforced by the 50-hour and 100-hour moving averages, both converging near the resistance zone and adding to its significance.
🔍 Key Observations:
- Volume Spike: A noticeable increase in trading volume accompanied the breakout, suggesting strong buying interest.
- Trend Line Support: The ascending maroon trend line continues to hold, indicating sustained bullish momentum.
- Moving Averages: The alignment of short- and medium-term MAs below the price adds further confirmation to the breakout.
- Historical Context: The previous struggle to break this resistance highlights the strength of the current move.
🚀 Outlook: With this resistance now flipped into support, we anticipate a more aggressive rally in the coming sessions. The next potential targets lie at 127,000 USDT and 136,000 USDT, which align with previous swing highs and psychological levels.
Traders should watch for consolidation above the breakout zone and monitor volume for signs of continuation. A retest of the 123K level could offer a secondary entry opportunity for those waiting on confirmation.
Penafian
Maklumat dan penerbitan adalah tidak dimaksudkan untuk menjadi, dan tidak membentuk, nasihat untuk kewangan, pelaburan, perdagangan dan jenis-jenis lain atau cadangan yang dibekalkan atau disahkan oleh TradingView. Baca dengan lebih lanjut di Terma Penggunaan.
Penafian
Maklumat dan penerbitan adalah tidak dimaksudkan untuk menjadi, dan tidak membentuk, nasihat untuk kewangan, pelaburan, perdagangan dan jenis-jenis lain atau cadangan yang dibekalkan atau disahkan oleh TradingView. Baca dengan lebih lanjut di Terma Penggunaan.